Poverty and the Oregon Workforce
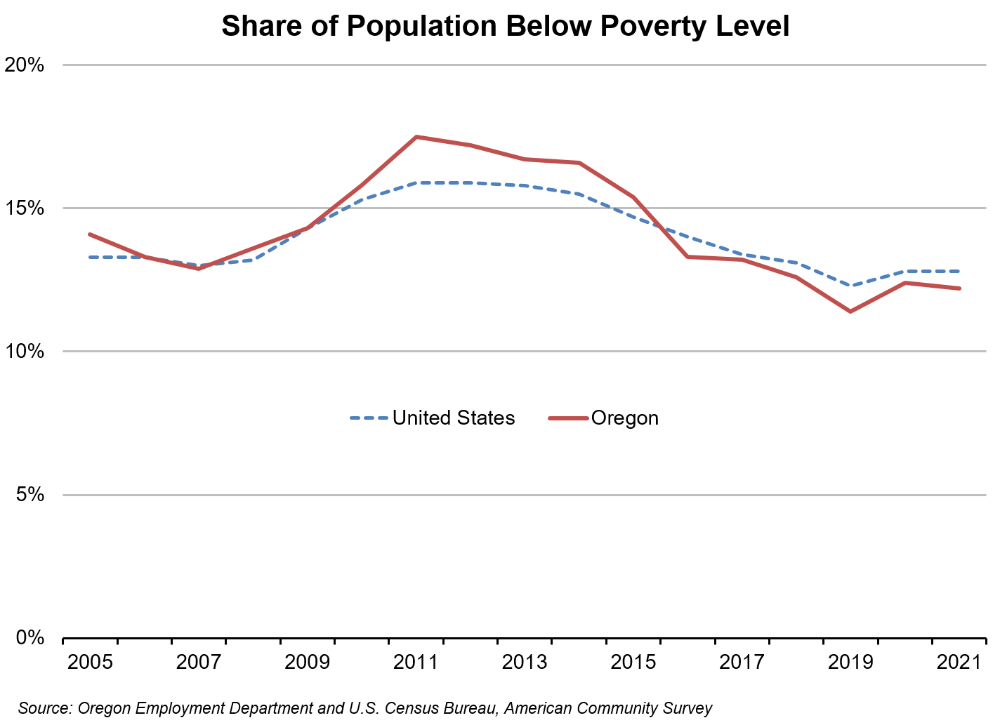
December 13, 2022The poverty rate across the U.S. reached 12.8% in 2020 and 2021, up from 12.3% in 2019. Prior to the pandemic, poverty had been falling incrementally since 2012. Oregon’s poverty rate was 12.2% in 2021, up from 11.4% in 2019. Poverty rates in Oregon have tracked pretty smoothly with the national trend over the past 15 years.
Many more details about poverty and changes in poverty between 2019 and 2021 are available in the Census Bureau report Poverty: 2019 and 2021. This report covers national, state, and major metropolitan poverty rate data from the American Community Survey, and goes deeper into poverty levels and changes since 2019. Some highlights include:
- In 2021, 5.7% of Oregonians had income below 50% of the poverty level, compared with 6.2% nationally. In both cases those rates were up about half a percentage point from 2019.
- Looking at those in poverty or near poverty, 15.9% of Oregonians had income below 125% of the poverty level in 2021, compared with 16.6% nationally. The share below 125% of poverty was up almost a full percentage point in Oregon since 2019 and just three-tenths in the U.S.
- Nationally, one out of eight U.S. residents received Supplemental Nutritional Assistance Program (SNAP) benefits in 2021. The 12.4% SNAP rate in 2021 was up from 10.7% in 2019. In Oregon, a larger share of residents received SNAP benefits, at 15.9% in 2021.
Poverty rates remained low in 2021 compared with the prior decade, after increasing slightly in 2020 during the pandemic. Oregon’s poverty rate peaked at more than 17% in 2011 and 2012, amid recovery from the Great Recession. Nationally, the poverty rate topped out below 16% in the post-recession period. By 2019, Oregon and the nation were back to poverty rates of about 11% and 12% – lower than prior to the Great Recession, but not by much.
We have poverty rate data through 2021, but don’t yet know the effects of high inflation and low real wage growth in 2022, as well as accelerated costs for carrying debt in the form of much higher interest rates. Poverty thresholds are updated annually to account for changes in the cost of living using the Consumer Price Index for all urban consumers (CPI-U). Those updated thresholds will capture more households below the poverty level if wage growth isn’t keeping up with inflation. However, they do not vary geographically, so local considerations like the regional cost of living, and years-long tight housing market and surging housing prices in Oregon, won’t play into our Census poverty thresholds.

Poverty among the Civilian Labor Force
Narrowing the population to just the civilian labor force – which is composed of people over the age of 16 who are either employed or actively looking for work – the poverty rate is lower. Among Oregonians in the labor force, the poverty rate was 6.8% in 2019 and 7.4% in 2021. When Oregon’s overall poverty rate peaked at 17.5% in 2011, the poverty rate among the civilian labor force was 12.4%.
Digging into more details of Oregon’s labor force, poverty among the employed portion of the labor force, at 5.9% in 2021, is just a fraction of the rate among the unemployed, at 30.1%. For those Oregon workers who had worked a full-time, year-round schedule in the prior 12 months, the poverty rate plummeted to just 1.9%. Those who worked part-time or part of the year in the prior 12 months had a poverty rate of 15.4%.
Some Groups Face Higher Poverty Rates
Poverty rates are higher for women than for men, both in the U.S. and Oregon, though the gap isn’t as wide in Oregon. Women’s lower average earnings, their greater family care responsibilities, especially among single mothers, and their longer life expectancies mean more women face poverty than men. In 2021, 12.9% of Oregon women and 11.5% of Oregon men had incomes below the poverty level. Nationally, the poverty rates were 11.6% among men and 13.9% among women.
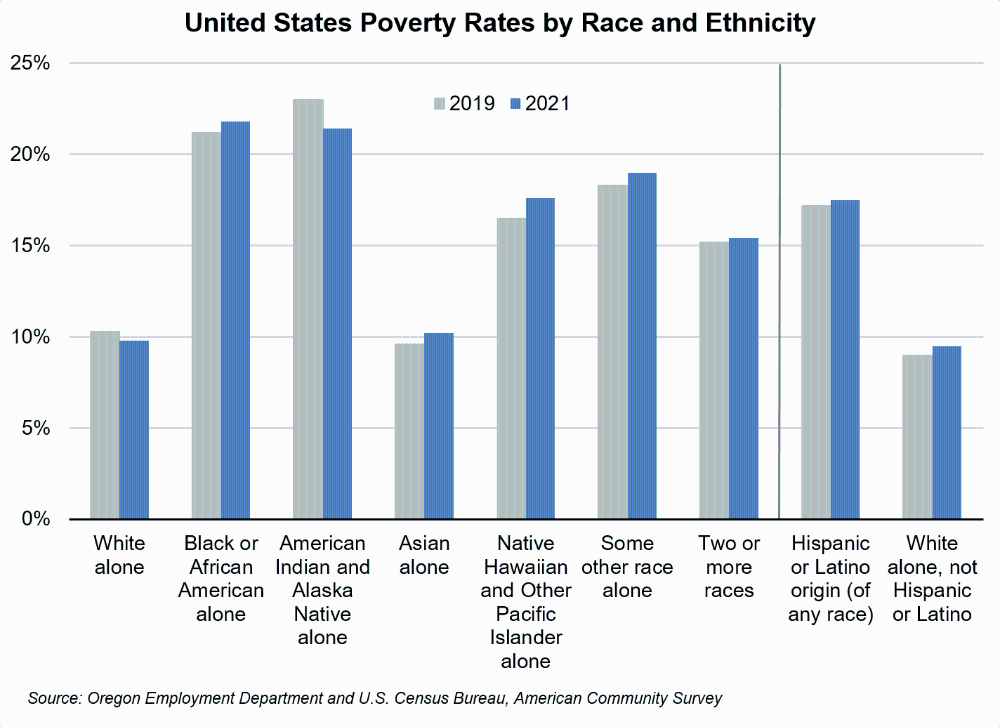
People of color are more likely to face poverty than white people. In the United States, the 2021 poverty rate for those self-reporting their race as white alone was 9.8%. For Black and African American people, the poverty rate was double that, at 21.8%. I chose national statistics for this comparison because the margins of error are much lower with national data. A vast majority of Oregonians are white alone, and for smaller groups, like Oregon’s Black and African American population and native Hawaiian and other Pacific Islander population, the single-year American Community Survey data isn’t very reliable. Still, looking at the numbers over the last several years, the general pattern in Oregon is similar to the U.S. – some minority communities bear the brunt of poverty.

Looking at the ethnicity breakout, Hispanics and Latinos face nearly double the poverty rate of those who are white alone, and not Hispanic or Latino.
Poverty and Age
Many of the people in the United States who fall below the official poverty threshold are children or elderly. This is why economic conditions and the availability of jobs don’t change poverty rates very drastically or quickly – many of the people in poverty aren’t willing or able to take a job, so job availability doesn’t change their likelihood of being below the poverty line.
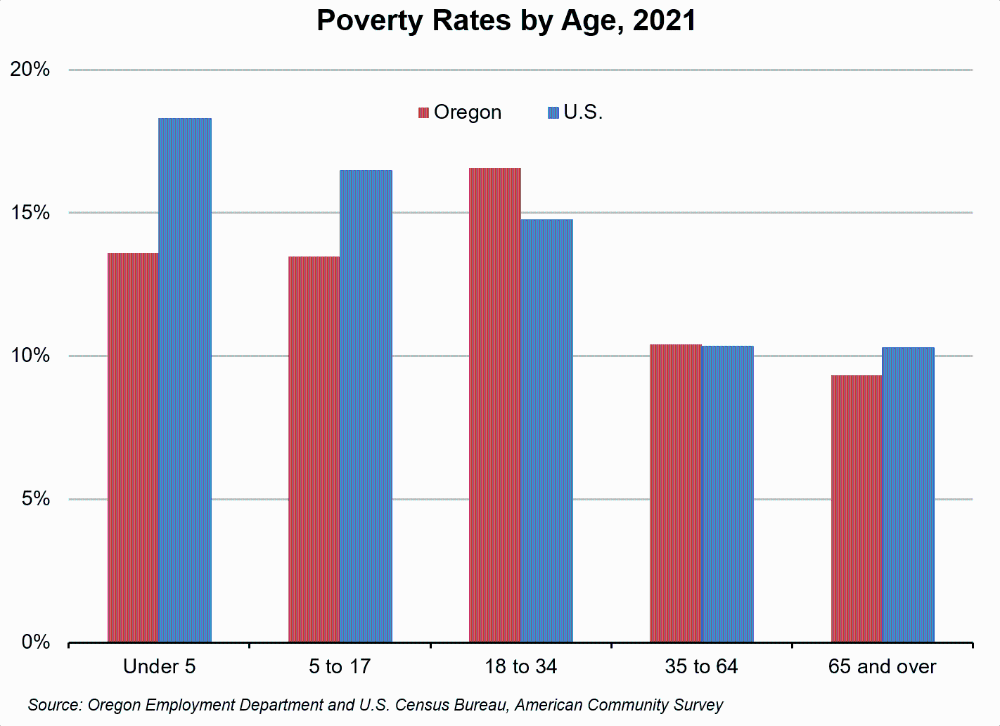
In 2021, 30% of the people below the poverty line in the U.S. were under the age of 18. In Oregon, a smaller share of those in poverty were children, at 22%. There were 27,600 Oregon children under the age of five in poverty in 2021; they made up 5% of people below the poverty line. Another 85,600 Oregon children ages five to 17 were in poverty, accounting for 17% of the total below the poverty line.
People age 65 and over account for 14% of people in poverty, both in Oregon and the U.S. In Oregon in 2021, an estimated 72,900 people age 65 and over had income below the poverty line. However, the population age 65 and over is large enough that the elder population actually has the lowest poverty rate. Oregonians age 65 and over make up 19% of the state’s population, but just 14% of those in poverty.
The highest poverty rate in Oregon is among those ages 18 to 34, at 16.6% in 2021. While the share of the population ages 18 to 34 matches the national average at 22%, people in this age group make up 30% of those in poverty in Oregon compared with 25% nationwide. Oregon’s poverty rates for children and for those over age 65 are below the national average.

The Pandemic and the Supplemental Poverty Measure
As of 2021, official poverty rates remained at a low level compared with the past decade. The Census report Poverty in the United States: 2021 explores both official poverty rates and the Supplemental Poverty Measure (SPM). The SPM expands upon the official poverty definition to include noncash benefits and resources, and subtract taxes and other necessary expenses. “By considering pretax money income alone, official poverty provides a consistent definition of poverty over long periods, but it does not capture many short-term policy changes that could affect family or household resources. As the Supplemental Poverty Measure (SPM) demonstrates, post-tax programs, such as stimulus payments and the Child Tax Credit, can have a significant impact on poverty rates.”
The SPM has been calculated since 2009. State level data are calculated only on a three-year moving average, which isn’t helpful for evaluating more local effects of short-term stimulus related to the pandemic, so we will rely on the national SPM data here. In 2020, the SPM dropped below the official poverty rate for the first time in the series, and it dropped another 1.4 percentage points in 2021, to reach 7.8%. Economic stimulus during and after the pandemic recession, and the temporary expansion of the Child Tax Credit, reduced the impact of the pandemic on the poorest residents during 2020 and 2021. Both of those sources of support dried up by 2022, amid inflation at forty-year highs and spiking interest rates that will no doubt harm low-income residents disproportionately.
Here are a few additional takeaways from the Census analysis of SPM changes from 2020 to 2021:
SPM rates for children (individuals under age 18) dropped the most, declining 4.5 percentage points from 9.7% in 2020 to 5.2% in 2021.
- The SPM showed the lowest childhood poverty rate on record back to 2009 for Black and African American children, Hispanic children, and non-Hispanic white children. Between 2020 and 2021, the rate dropped the most among Black children (-8.8 percentage points) and Hispanic children (-6.3 percentage points).
- The gap between male and female SPM rates narrowed in 2021, with both groups declining by more than a percentage point to rates of 7.6% among males and 7.9% among females.
- In 2021, the SPM rate for those with less than a high school diploma (19.7%) was more than four times higher than the SPM for those with a bachelor’s degree or higher (4.3%).
Using the three-year average from 2019 to 2021, Oregon was one of 38 states where the SPM was below the official poverty rate. SPM rates were higher than the official rate in just three states (including our neighbor California), and the rates weren’t statistically different in nine states. SPM rates coming in below official rates is a temporary phenomenon. With what we know about conditions in 2022, it’s likely both SPM rates and official poverty rates will increase in the short-term with the effects of inflation and the end of pandemic-related stimulus.