Internal Revenue Service Migration Data Show Positive In-Migration Trends at the South Coast
August 9, 2023The 2020-2021 migration patterns were recently released by the Internal Revenue Service (IRS). Migration data for the United States are based on year-to-year address changes reported on individual income tax returns filed with the IRS. They present migration patterns by state or by county for the entire United States and are available for inflows (the number of new residents who moved to a state or county and where they migrated from), and outflows (the number of residents leaving a state or county and where they went).
These migration patterns show the number of returns and exemptions (a good proxy for people) that filed their federal taxes in a different county from the previous year. Not only can this data help show the volume of migrants into or out of the South Coast, but it also reveals the county of origin for those moving here. On the other hand, we can also track where folks move to when they file their taxes with a different address than their prior year’s tax return.
Net migration was positive in Coos County in 2021. There were 3,246 exemptions that migrated to Coos County and 2,935 exemptions who migrated out of the county, for a net migration increase of 311 exemptions or people. Of the 3,246 who migrated to Coos County, 1,976 came from a different state and 1,270 came from a different county in Oregon. Among the 2,932 who migrated out of Coos County, 1,657 left for a different state and 1,278 migrated to a different county in Oregon.
Population estimates from Portland State University Population Research Center show a net migration increase of 784 new residents in Coos County from July 1, 2020 to July 1, 2021 – trending stronger than from the IRS data. The PSU series does not cover exactly the same time period as the IRS tax year data. Also not everyone who migrated here may have filed taxes during the period the IRS collects data for that year. Late filers would be excluded from the annual IRS migration data.


Net migration was also positive in Curry County in 2021. There were 1,592 exemptions that migrated to Curry County and 1,267 exemptions who migrated out of the county for the most recent year available. Of the 1,592 who migrated to Curry County, 1,120 came from a different state and 472 came from a different county in Oregon. Among the 1,267 who migrated out of Curry County, 732 left for a different state and 535 migrated to a different county in Oregon.
Population estimates from Portland State University Population Research Center show net migration gain of 624 new residents in Curry County from July 1, 2020 to July 1, 2021 – trending similarly but stronger than the IRS data.
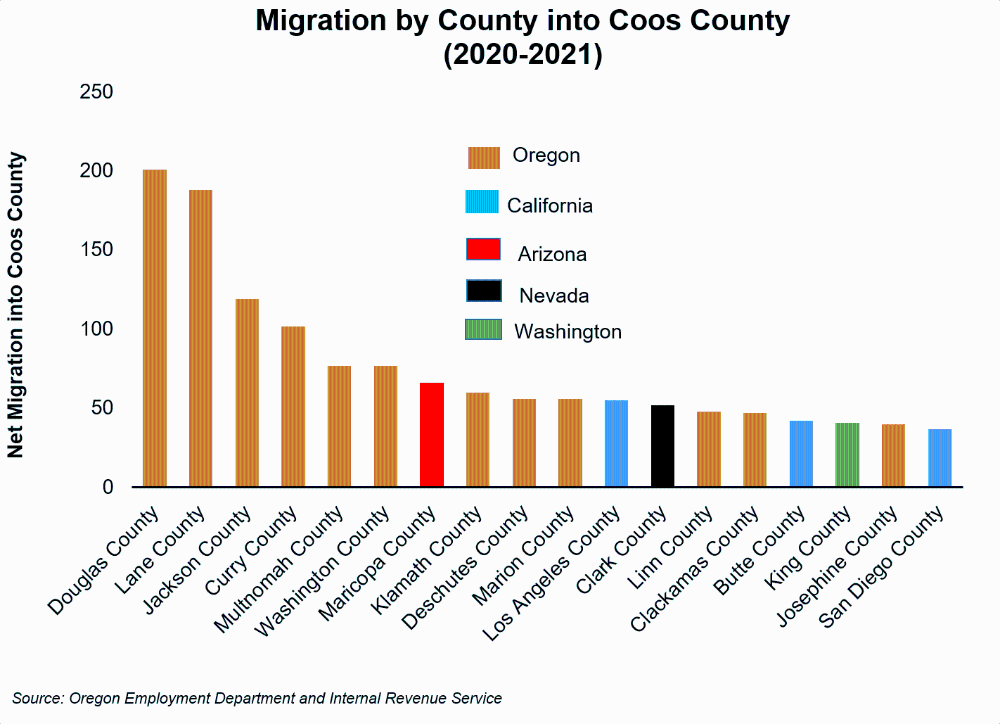
The top in-migration counties into Coos County include a majority coming from Oregon counties, but a number from California counties including Los Angeles, San Diego, and Butte County. A large number moved from Douglas (+201) and Lane (+188) counties from 2020 to 2021. California had 134 exemptions/people migrate to Coos County between 2020 and 2021 among the counties where data are available.
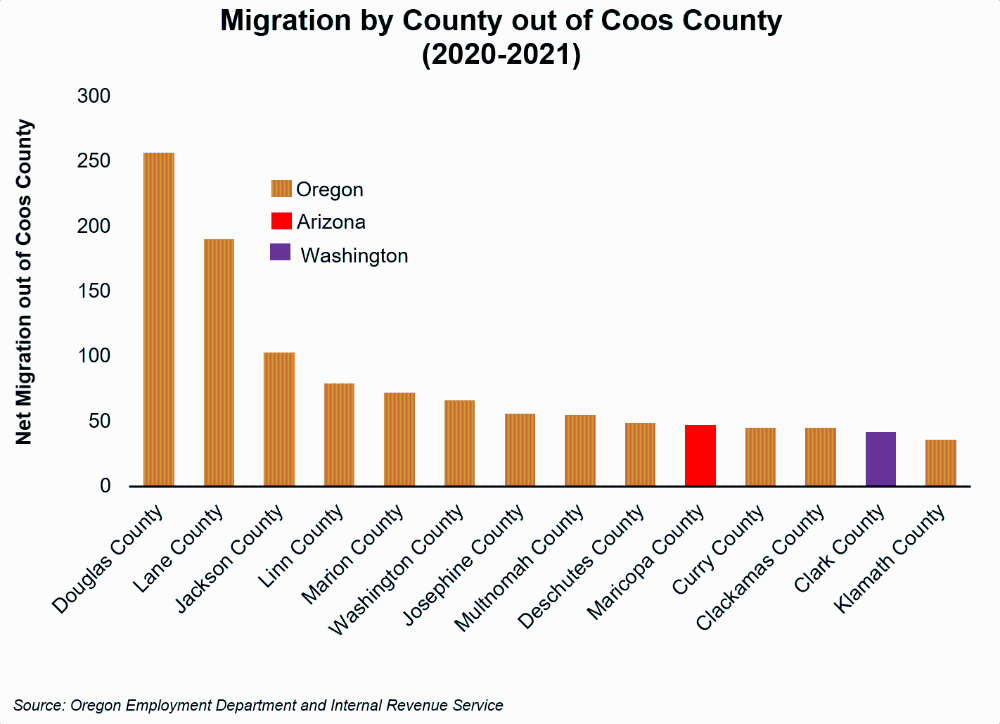
Coos County saw the most people out-migrate to Douglas (-257), Lane (-190), Jackson (-103), and Marion county (-72).
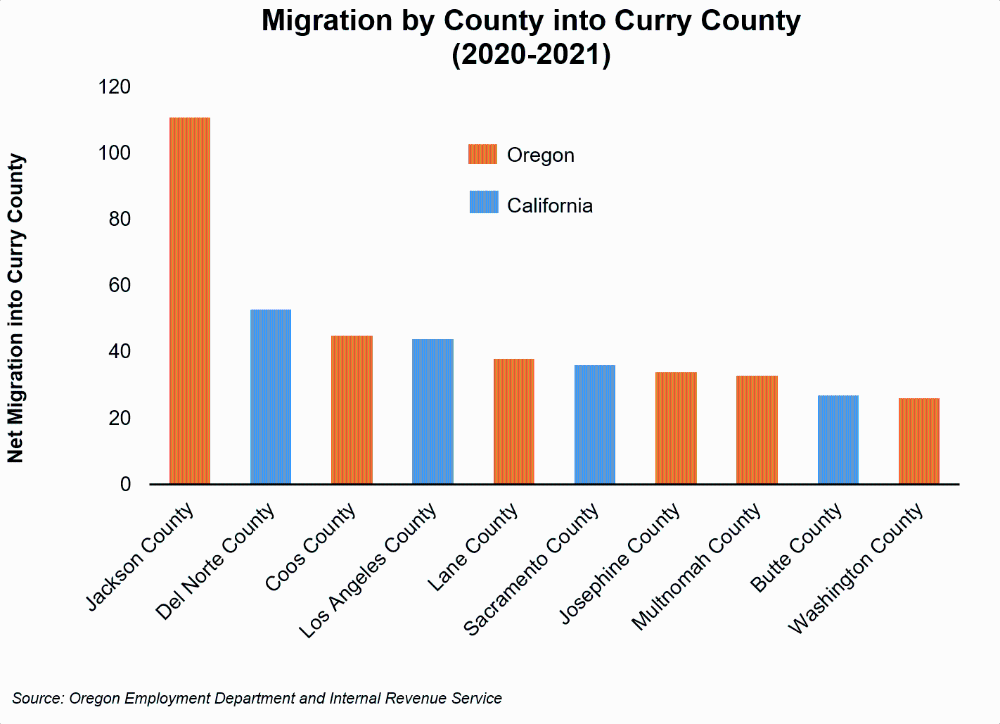
The top Curry County in-migration counties include a number from California, but the top county was Jackson, where 111 residents migrated to Curry County. Other Oregon counties where people moved from and to Curry County were Coos (+45), Lane (+38), Josephine (+35), and Multnomah (+33). The California in-migration effect is quite apparent looking at the top net in-migration counties in 2021, with Del Norte, Los Angeles, and Sacramento having the second, fourth, and sixth greatest number of people migrating to Curry County.

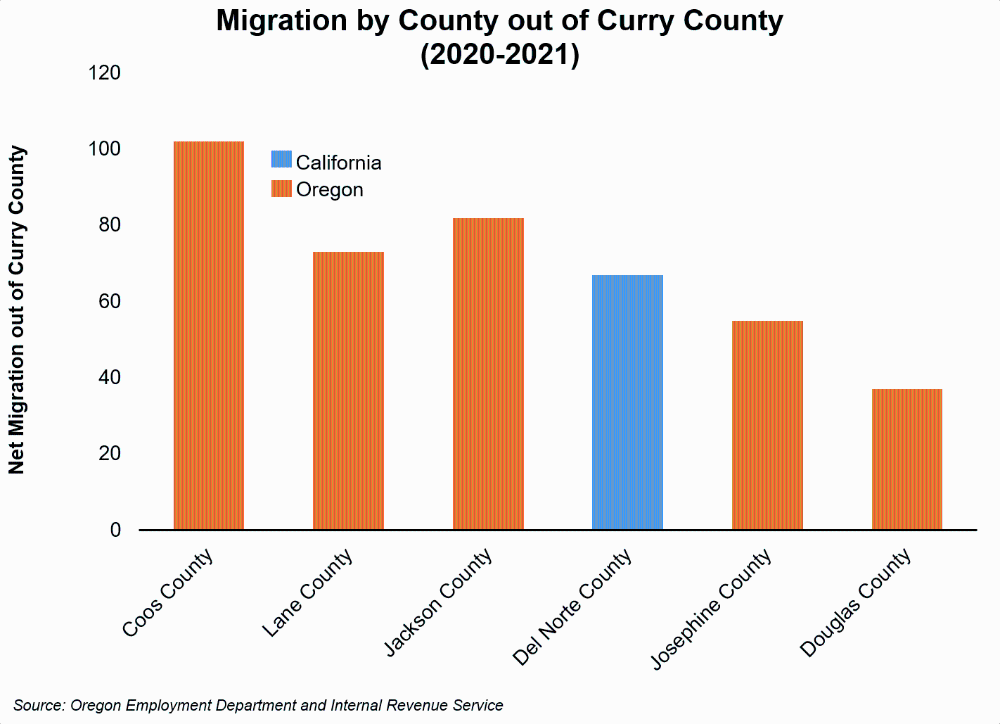
Looking at out-migration from Curry County, five of the six published counties where people moved to were other Oregon counties, with the other county Del Norte county in California where 67 exemptions/people migrated from Curry County.

New people become critical contributors to our local labor force, and create or relocate businesses at the South Coast. New residents bringing diverse perspectives, and more importantly, are looking for many of the same quality of life benefits that those of us that call this place home value.
Notes about IRS Migration Data
The data are available for Filing Years 1991 through 2021 and include:
- Number of returns filed, which approximates the number of households that migrated
- Number of personal exemptions claimed, which approximates the number of individuals
- Total adjusted gross income, starting with Filing Year 1995
- Aggregate migration flows at the State level, by the size of adjusted gross income (AGI) and age of the primary taxpayer, starting with Filing Year 2011.
For more information and to download the data go to: https://www.irs.gov/statistics/soi-tax-stats-migration-data.