Top Occupations Oregon Employers Were Hiring in 2023 Job Vacancies
March 8, 2024The total estimate of Oregon job vacancies dropped to 72,815 in 2023 after reaching a record level of about 104,000 in 2022. In 2023, the number of job vacancies remained 27% above the level in 2019, at the end of a long economic expansion and just before the onset of the pandemic. After the rapid job recovery and growth that took place in 2021 and 2022, employers were hiring for a wide variety of jobs; they reported vacancies across 380 different occupations.
Throughout the year, the Oregon Employment Department surveys private employers with two or more employees from all industries and areas of the state to ask about job vacancies they are actively trying to fill. For each vacancy, the employer provides the job title, starting wage, and education and experience requirements for the job. Details about the decline in vacancies are available in Oregon Job Vacancies: Hiring in 2023 Slowed After Record High Levels in 2022.
Job Titles with the Most Hiring Activity
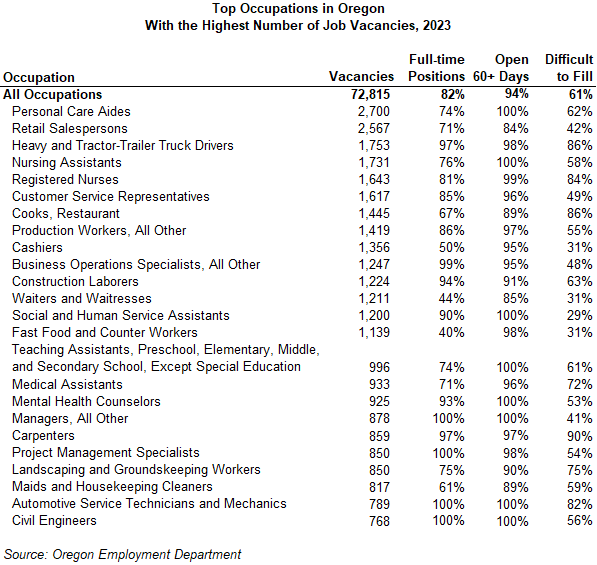
Occupations with the highest number of job vacancies in 2023 reflected a more stable employment picture after the rapid job recovery following the pandemic. Occupations with the most openings in 2023 included personal care aides (2,700); retail salespersons (2,600); heavy truck drivers (1,800); nursing assistants (1,700); registered nurses (1,600); and customer service representatives (1,600).

While overall hiring demand declined in 2023, most job vacancies continued to be for full-time, permanent jobs. In most of the top occupations, at least seven out of 10 openings were full-time. Jobs more likely to be part-time included fast food and counter workers; waiters and waitresses; cashiers; and maids and housekeeping cleaners.
Employers were looking to permanently fill jobs with remarkable consistency – among most occupations nine out of 10 openings were permanent. Retail salespersons (84%) and waiters and waitresses (85%) had the lowest shares of permanent jobs among these top occupations.
In 2021 and 2022, more than a third of vacancies had been open for 60 days or longer when they were reported to the survey. That share dropped to 25% in 2023 as employers were able to fill their job openings more rapidly than during the hiring heyday of the recovery. In 2019, one out of six vacancies had been open for 60 days or longer. Among occupations with more than 1,000 vacancies in 2023, those with the highest shares open 60 or more days included registered nurses (39%), business operations specialists (33%), and construction laborers (30%). Occupations with the lowest shares open 60+ days included fast food and counter workers (7%) and personal care aides (9%).
Employers continued to report more than half of their vacancies as difficult to fill in 2023, at 61% compared with 72% in 2022. Prior to and during the pandemic, closer to half of vacancies were reported as difficult to fill. Of occupations with more than 1,000 job vacancies in 2023, employers reported the most difficulty filling openings for heavy truck drivers (86%), restaurant cooks (86%), and registered nurses (84%). Less than one-third of openings were difficult to fill among social and human service assistants (29%), cashiers (31%), waiters and waitresses (31%), and fast food and counter workers (31%).
Hiring Activity by Broad Category
The detailed occupations in the first table, those with more than 750 vacancies in 2023, accounted for 42% of all vacancies reported. Vacancies were reported in a total of 380 occupations over the course of the year. Summing these openings up by broad occupation group gives us a more thorough sense of the hiring happening in 2023.

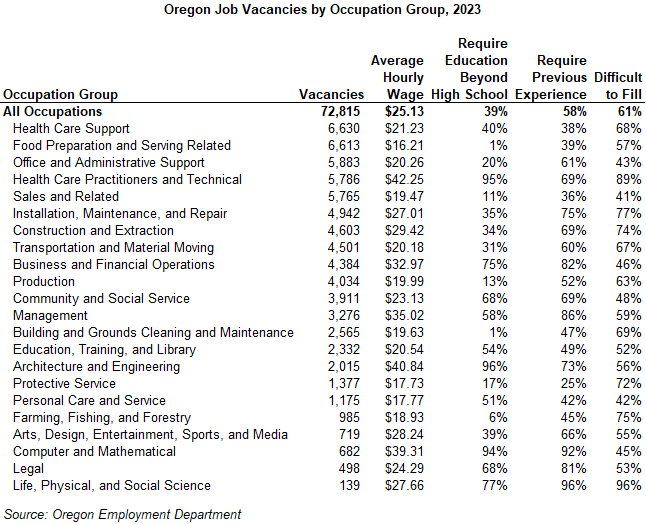
Five occupation groups had more than 5,000 vacancies at any given time in 2023. Health care hiring was evident in strong hiring for health care support (6,600) and health care practitioner and technical occupations (5,800). Food preparation and serving (6,600), office and administrative support (5,900), and sales and related occupations (5,800) rounded out the top five. A total of nine occupation groups had more than 5,000 vacancies apiece at any given time in 2022, the same as in 2021 and up from three groups in 2019 experiencing that volume of hiring.
Most occupation groups, 18 out of 23, had fewer job vacancies in 2023 than in 2022. In total, the number of job vacancies in 2023 was 30% below the level in 2022. Personal care and service, food preparation and serving, and transportation and material moving job openings declined by more than 50%. Community and social service, and architecture and engineering vacancies increased by about 50% in 2023.
Among the smaller group of 2023 vacancies, a higher share required education beyond high school, at 39%, and previous experience, at 58%. In 2022, 29% of vacancies required education beyond high school and 52% required previous experience. The share requiring education beyond high school ranges from more than 90% of health care practitioner, architecture and engineering, and computer and mathematical vacancies, to less than 5% of food preparation and serving, and building and grounds cleaning and maintenance jobs. Occupation groups with higher shares requiring education and experience also tended to pay higher starting wages.