Ready, Willing, and Able
July 11, 2023
On July 26, the United States celebrates the anniversary of the Americans with Disabilities Act, which prohibits discrimination against people with disabilities in employment, education, transportation, state and local government services, public accommodations, telecommunications, and commercial facilities. This anniversary serves as a good opportunity to celebrate the contributions of people with disabilities in Oregon’s labor force as well as highlight challenges they face.
What Is a Disability?
Definitions of “disability” vary. The Americans with Disabilities Act, which governs many state and federal programs, defines a disability as a physical or mental impairment that substantially limits one or more major life activities. Other programs have different definitions. The American Community Survey asks respondents if anyone in the home had difficulty with hearing, vision, remembering, walking, dressing, eating, or doing errands.
Many conditions can be disabling. While functional limitations from physical and sensory disabilities may be the more obvious barriers to employment, many other conditions can make it difficult to find or keep a job. Reading disabilities, mental health problems, chemical sensitivities, and medical conditions may not be as noticeable, but they can be just as limiting.
Oregonians with Disabilities
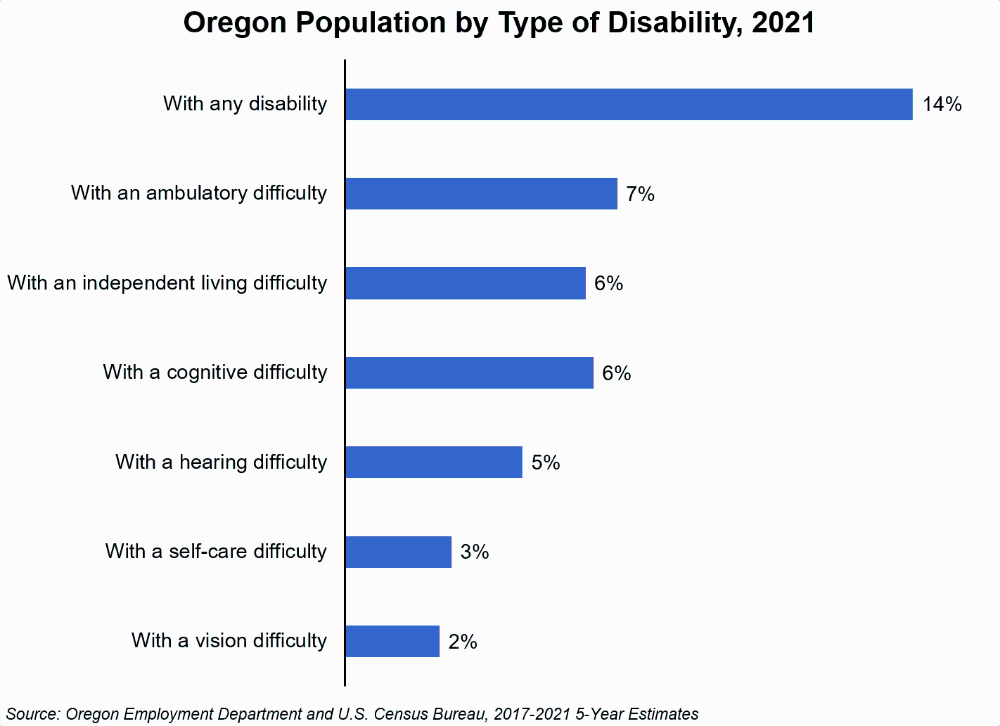
In Oregon, there were about 600,000 people with disabilities on average from 2017 to 2021, according to the American Community Survey. This represented roughly 14% of Oregon’s civilian noninstitutionalized population. Among the population of working age, those 18 to 64, about 306,600 had disabilities. Ambulatory disabilities were the most common type of disability during this period.

Older people are more likely to have a disability than the general population. In Oregon, 49% of individuals ages 75 years and older have a disability, compared with about 6% of the population ages five to 17.
Although the frequency of most types of disabilities increases with age, ambulatory, hearing, and independent living difficulties showed the most dramatic increases for people over age 65. Twenty percent of seniors reported an ambulatory difficulty compared with 7% of people of all ages. Sixteen percent of seniors reported a hearing difficulty compared with 5% of all people. Thirteen percent of seniors reported an independent living difficulty compared with 6% of the overall population.
Disability Rates Vary Across Demographic Groups
The share of the population with a disability varies by race and ethnicity. American Indians or Alaska Natives in Oregon are the most likely to have a disability, at 20% of the population. Oregon’s white alone and Black alone populations are about equally likely to have a disability at roughly 15% of their populations. Thirteen percent of those identifying as two or more races reported having a disability. Asians, Native Hawaiians and Other Pacific Islanders, and those identifying as some other race were the least likely to report having a disability at 8% for Asians, and 9% for Native Hawaiians and Other Pacific Islanders and for those identifying as some other race. Nine percent of Hispanic or Latino people in Oregon, who can identify as any race, reported having a disability.
American Indians and Alaska Natives had the highest share of the population with a disability compared with the state as a whole despite being relatively younger, with a median age of 34.5 years compared with Oregon’s overall median age of 39.6 years. Those identifying Black alone and as two or more races had similar shares of their populations with a disability as the state as a whole, despite being relatively younger at 33.2 years and 26.8 years, respectively.
Veterans were also more likely to report having a disability at 33% of the population ages 18 years and older compared with 16% of the overall adult population. Men and women were about equally as likely to report having a disability at 15% and 14%, respectively.
Employment Rates and Earnings Lower for People with Disabilities
According to the U.S. Bureau of Labor Statistics, the unemployment rate for people with disabilities was 7.6% nationally in 2022, 4 percentage points higher than that of people with no disability. Similar to the nation as a whole, Oregonians with disabilities had lower employment rates than those without disabilities. About 26% of Oregonians ages 16 years or older with disabilities were employed versus 66% of those with no disabilities. People who are neither employed nor unemployed are not in the labor force. About 70% of Oregonians with disabilities were not in the labor force versus 30% of those with no disabilities.
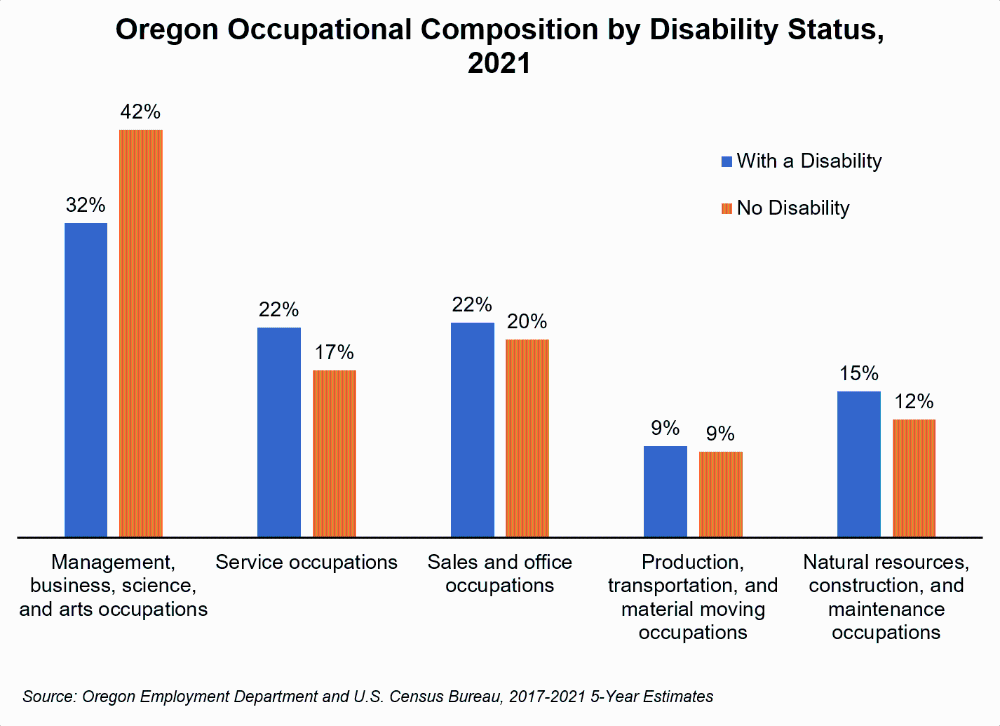
Oregonians with disabilities hold a variety of jobs. People with and without a disability are about equally likely to work in most occupations. Some occupations serve as notable exceptions to this rule, however. Relatively fewer people with a disability work in management, business, science, and arts occupations and relatively more work in service occupations and production, transportation and material moving occupations.

The different rates of employment in these occupations may be a reflection of different educational outcomes for Oregonians with disabilities. Twenty-one percent of people with a disability had a bachelor’s degree or higher versus 38% of those without a disability. Thirteen percent of people with a disability didn’t graduate high school versus only 7% of people without a disability.
These occupational differences are also correlated with the smaller proportion of people with disabilities in higher income groups. About 39% of working people ages 16 and over without a disability earned $50,000 or more in the 12 months prior to answering the 2017 to 2021 survey versus only 25% of people with a disability.
Earnings for people with disabilities are lower than for those with no disabilities. Oregonians with disabilities had median earnings of $25,530 compared with median earnings of $39,052 for Oregonians without disabilities. Women with disabilities had lower earnings than men with disabilities. From 2017 to 2021, women’s earnings ($21,076) represented about 70% of men’s earnings ($30,158).
Continued Barriers to Work for People with Disabilities
A 2015 study on disability, the Kessler Foundation National Employment and Disability Survey, examined how people ages 18 to 64 with disabilities strive to work. It showed that 68% of this group did strive to work, 43% did so by being employed, 7% had worked since the onset of a disability and were actively looking for another job, and 17% had worked since the onset of a disability but weren’t actively looking for work. About 61% of all respondents said that work was very important to them, and 41% of those employed said that they wanted to work more hours per week.
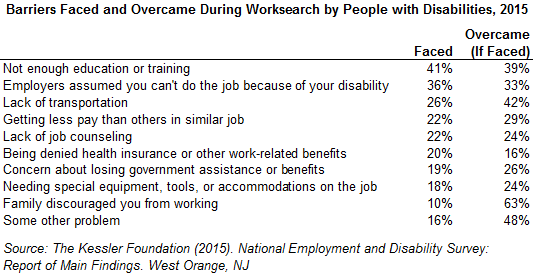
The Kessler survey also looked at barriers individuals with disabilities faced in gaining employment. Some challenges were common to any job seeker, such as lack of education or transportation (although getting suitable education or transportation may be a challenge), but a major barrier was employers’ assumption that the person couldn’t do the job because of their disability. It was also a hard barrier to overcome; only a third of the job seekers were able to do so. Other barriers, such as family discouragement, were easier to overcome.

Increases in Telecommuting Could be Opening Doors
There is some recent evidence that pandemic-era shifts in working conditions could be reducing some of these barriers to work experienced by people with disabilities. An article published in November 2022 by Aru Ne’eman and Nicole Maestas titled “How has COVID-19 impacted disability employment?” shows that, unlike previous recessions, people with disabilities have seen disproportionate gains in employment after the pandemic recession. By the second quarter of 2022, the employment rate for people with disabilities had exceeded its pre-pandemic levels by about 3.6%. The employment rate for people without disabilities during this period still trailed pre-pandemic levels by 0.5%.
The increase in telecommuting and flexible working conditions post-pandemic is likely a contributing factor behind the strong employment growth for people with disabilities. Given that lack of transportation and the need for special accommodation represent barriers for a significant number of workers with a disability, the ability to work from home could contribute to progress in employment.
Gateways to Employment
Several Oregon businesses offer specialized training and job coaching services to people with disabilities. Besides helping disabled workers find and keep jobs, these services can reduce company costs associated with new hires. To find out more about the benefits of hiring workers with disabilities, visit:
the Oregon Resource Association,
the Employment First policy of the Oregon Department of Human Services, and
the Ticket to Work program.
For assistance in hiring people with disabilities, visit the Employer Services site of the Office of Vocational and Rehabilitation Services and the Services for Employers site of the Oregon Commission for the Blind.