Oregon’s Aging Workforce by Industry and County in 2022
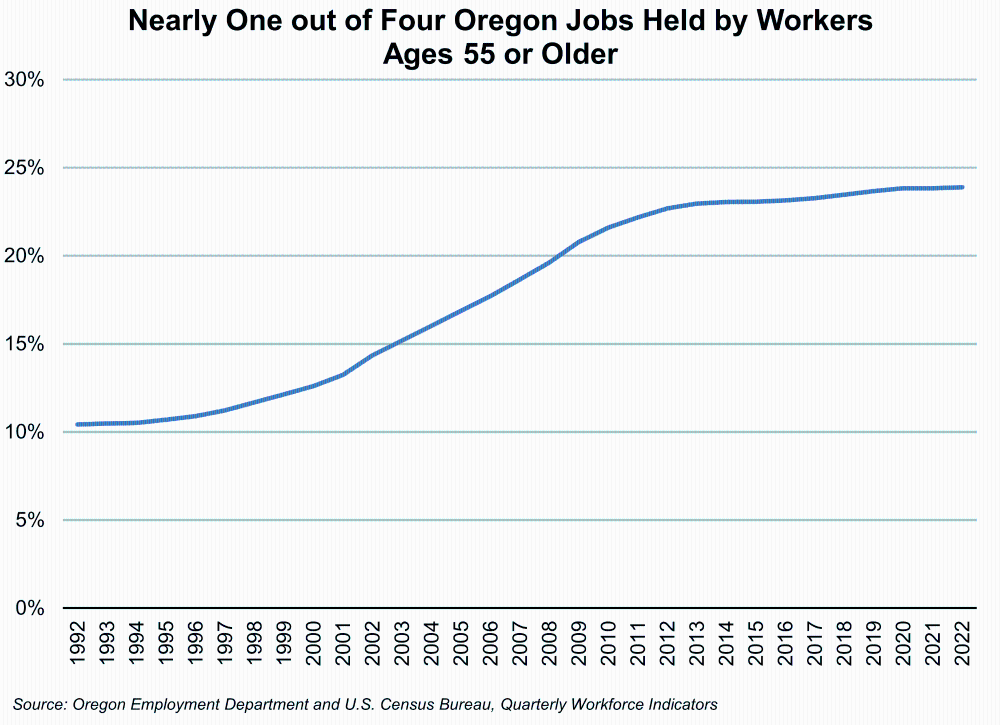
January 8, 2024Oregon’s workforce is aging. The number of Oregon jobs held by workers age 55 and older more than tripled from 1992 to 2022, while the state’s total number of jobs grew 56%. Workers 55 years and over held 10% of all jobs in 1992. By 2022, that share increased to 24%. The entire Baby Boomer Generation, born 1946 to 1964, is now 55 and older, and they are more likely to be in the labor force than previous generations were at ages 55 and beyond. Many of these workers may plan to retire in the next 10 years, taking their skills and experience with them.

The aging workforce is a general demographic trend that’s expected to continue in the coming years. It impacts employers, industries, and regions to varying degrees. Employers should know the age profile of their own workforce so they can plan accordingly for increased turnover and recruitment efforts due to retirements. At a broader level, workforce planners need to know the demographic profiles of entire industries and regions to help gauge the need for future replacement workers.
Health Care Has the Most Workers Age 55 and Over
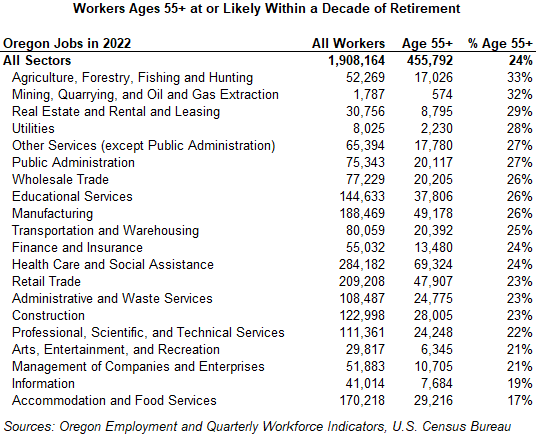
The pace of retirements will likely be faster in industries that have an older workforce profile. Industry age profiles vary. The relatively young accommodation and food services sector has 17% of jobs held by workers ages 55 and over. By contrast, one out of three jobs (33%) in the mining and quarrying sector are held by workers 55 and older. Although natural resources, utilities, and real estate have higher concentrations of older workers, they employ fewer workers than many industries and are expected to require relatively fewer replacement workers. Some employers in industries with a large number of workers 55 years and older may struggle to a greater degree to find enough workers if they don’t plan ahead.

Health care (both private and public) stands out for the size of its aging workforce, with nearly 70,000 workers ages 55 and over. Other industries with a large number of workers nearing retirement age include manufacturing (49,000 workers), retail trade (48,000), and private and public educational services (38,000). Employers in these and in all other industries need to plan for how they are going to attract replacement workers, especially for jobs that require significant training.
Rural Counties Have Older Workforces
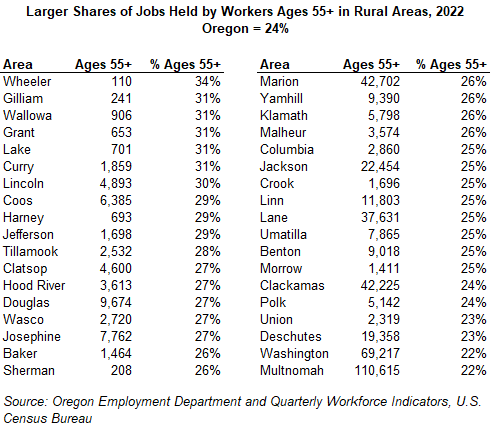
Rural counties tend to have higher shares of older workers and could feel the impact of the aging workforce more than metro counties. More than one out of four jobs (27%) were held by workers 55 years or older in rural areas. That represents approximately 64,000 workers in rural Oregon who may be looking to retire within the next decade.

Seven counties had 30% or more of their jobs held by workers ages 55 and over. All seven are rural counties at significant distances from urban centers: Wheeler, Gilliam, Wallowa, Grant, Lake, Curry, and Lincoln counties.
Although older workers are a smaller share of the workforce (23%) in metro counties, there are a lot more of them. Multnomah County alone has more workers ages 55 and older (111,000 workers) than all of rural Oregon combined (66,000). Multnomah County also has nearly as many jobs held by workers ages 45 to 54 (107,000) as those 55 and older. Meanwhile, rural Oregon has fewer jobs held by workers ages 45 to 54 (49,000).
Employers in metro counties will generally tend to have a larger pool of younger workers to recruit from when replacing retiring workers. Rural counties will need to either recruit workers from other areas, or engage area workers who aren’t actively in the labor force, just to maintain the size of their current workforces.
Employment by Age Data
Information about employment by age group for industries and counties is from the U.S. Census Bureau’s Center for Economic Studies Longitudinal Employer-Household Dynamics (LEHD) program and the Local Employment Dynamics (LED) partnership with the states. Employment data is the average of quarterly employment for 2022.
To explore and use the data available from LED, visit lehd.ces.census.gov.