Oregon Jobs in 2022: A Wage Data Perspective
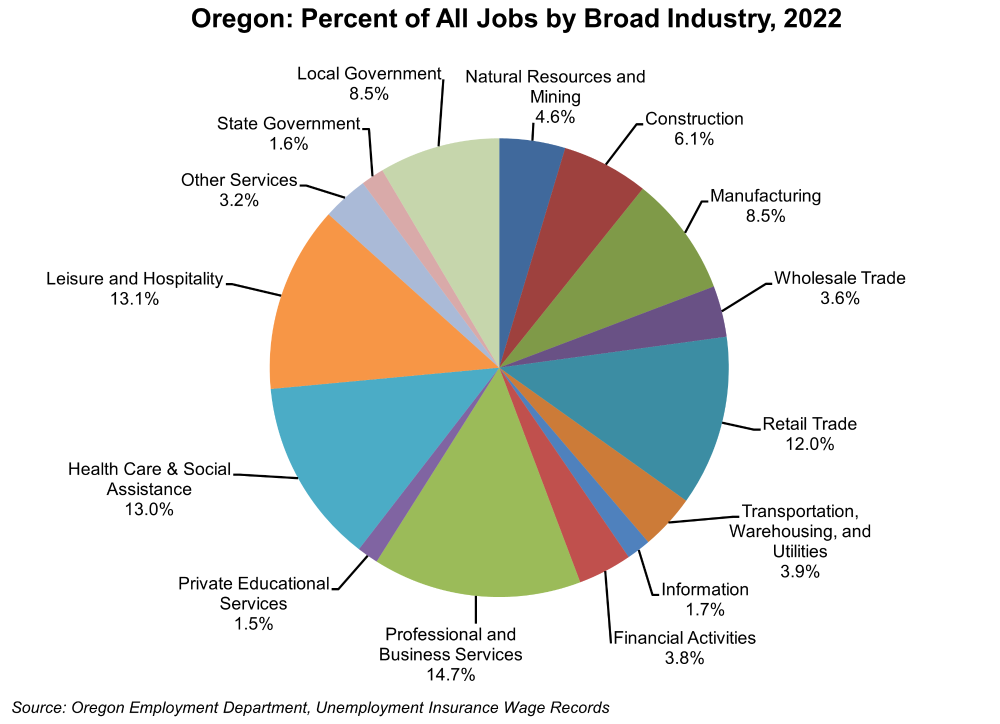
November 30, 2023In 2022, Oregon’s industries provided 3,209,300 jobs, a gain of 113,900 (3.7%) over the prior year. All broad industries except for retail trade added jobs in 2022. Leisure and hospitality (+36,400), professional and business services (+24,000), and local government (+12,100) saw the largest absolute job gains. At the other end of the spectrum, retail trade lost 3,100 jobs (-0.8%).

Recovery from the Pandemic Recession in spring 2020 has occurred quickly compared with previous recessionary periods, such as the Great Recession, when between 2006 and 2009, more than 450,000 jobs were lost. Professional and business services, which includes temporary help services, lost the most jobs – roughly 100,000 – and shrank by 25.8% during the recession. That same industry lost only 8.0% of its jobs from 2019 to 2020, grew by 7.3% from 2020 to 2021, and added 5.4% from 2021 to 2022, fully recovering from the pandemic losses and continuing to grow.
Leisure and hospitality was hard-hit by the Pandemic Recession – a loss of over 78,000 jobs occurred in 2020, or 17.9%. This percentage drop was similar to the percentage of jobs lost during the Great Recession for leisure and hospitality. The industry had grown significantly, however, since the Great Recession. Further, leisure and hospitality had the largest number of job gains in 2022; gaining more than 36,000 jobs, a growth rate of 9.5%. This continues its trend of strong job growth from 2021 when the industry added over 26,000 jobs (+7.3%).
The median hourly wage of all jobs rose from $21.39 to $23.09 in 2022 – a year-over-year increase of 8.0%, possibly affected by increases in the minimum wage as well as a tight labor market where workers could demand higher wages. All industries saw their median hourly wages increase by at least 4.1%. Five industries had stronger wage growth than the average for all industries: professional and business services (11.5%), leisure and hospitality (10.0%), information (9.4%), retail trade (8.8%), and manufacturing (8.0%).
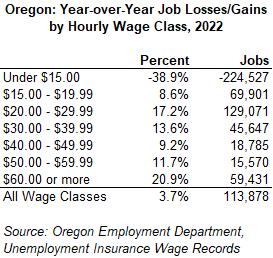
Thirty-four percent of all 2022 jobs paid at least $30 per hour. Over 61% (1,975,700 jobs) paid at least $20 per hour – much greater than the percentage (11.0%) that paid less than $15 per hour. All but the lowest hourly wage class posted job gains. With the annual increases in the minimum wage that began in July of 2016, the number and percentage of jobs paying less than $15 per hour began to decrease from year to year. In 2021, the number of jobs that paid less than $15 per hour dropped by 200,000. In 2022, this trend continued; almost 225,000 fewer jobs paid less than $15 per hour.
All of the other hourly wage categories posted gains in 2022. The $60 or more (+20.9%) and $20 to $29.99 (+17.2%) wage categories saw the largest year-over-year percent increases in number of jobs. The four remaining hourly wage categories all saw a minimum of 8.6% increases in numbers of jobs. This is evidence of the strong labor market and continued Pandemic Recession recovery in 2022.

To see detailed annual tables, visit www.QualityInfo.org, go to the Data page, and click “Oregonians @ Work” to find Annual Wage Tables.