Oregon Hourly Earnings Zoom Higher
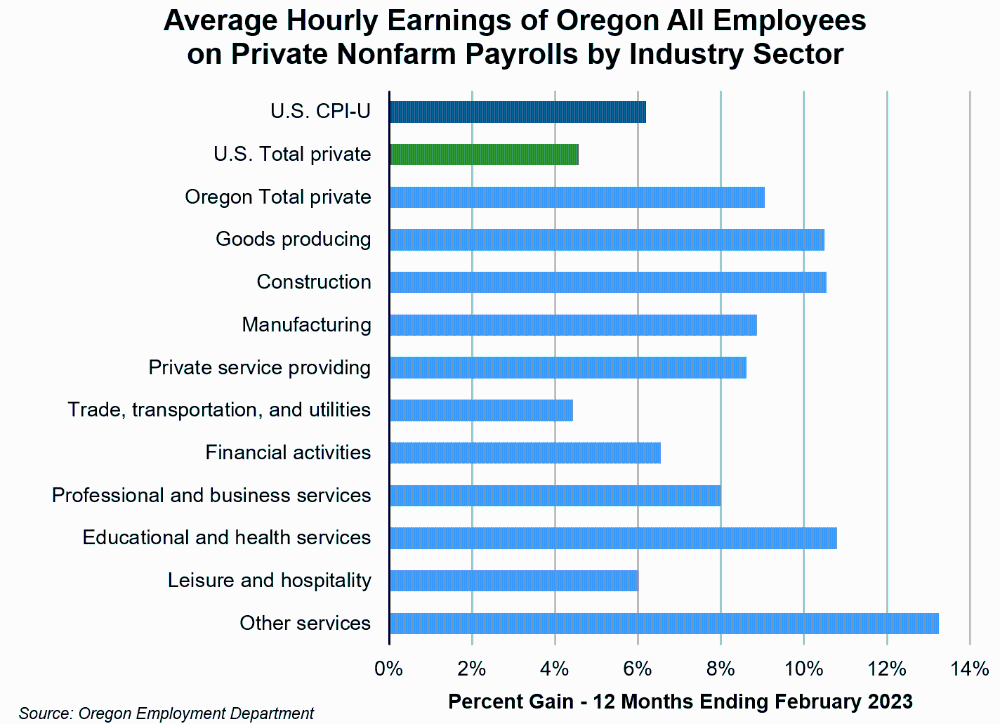
March 29, 2023Earnings in Oregon increased sharply over the past year, surpassing the high rate of inflation. Total private average hourly earnings increased by 9.1% between February 2022 and February 2023. This growth rate was much higher than the comparable national growth in private earnings of 4.6% in that same 12-month period, and faster than the U.S. Consumer Price Index for All Urban Consumers (U.S. CPI-U) which shot up by 6.2% during that time.
The accompanying chart shows the percent growth in average hourly earnings for the major private-sector industries in Oregon. All of these industries saw rapid hourly earnings gains and all but one shot upward by between 6% and 13%. The slowest growth was still heady territory, as hourly earnings in trade, transportation, and utilities rose by 4.4%.

The factors causing these rapid gains in hourly earnings is beyond the scope of this article. Suffice it to say that wages have spiked faster than we have been used to seeing over the past couple of decades.
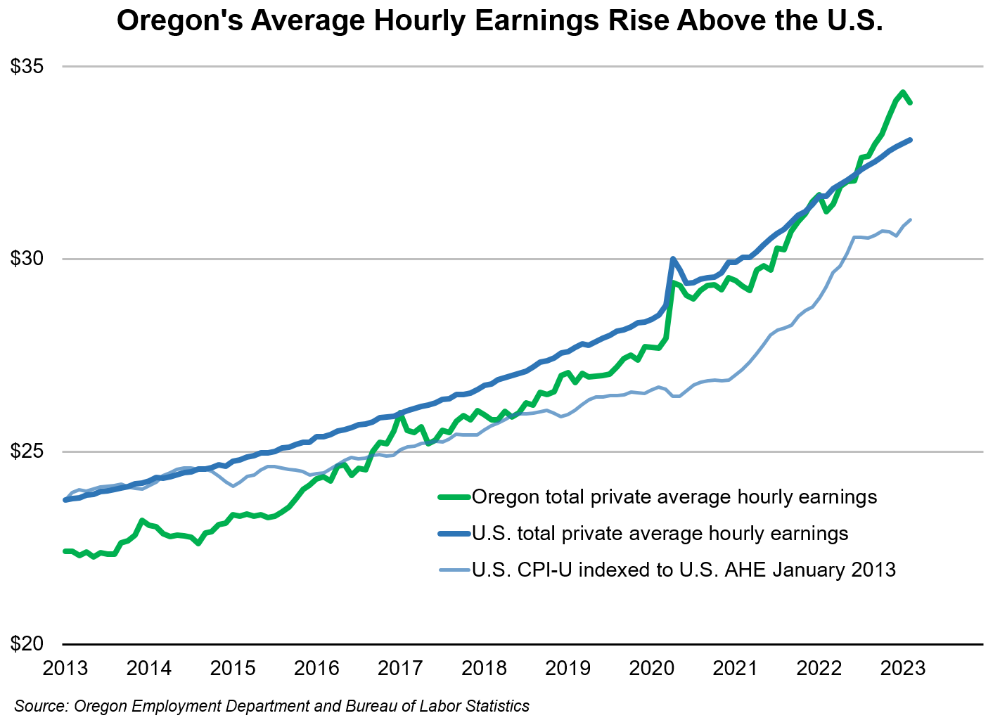
Looking back over about 10 years shows that private-sector average hourly earnings in Oregon rose from a little more than $22 per hour in 2013 to about $34 per hour in early 2023. Meanwhile, at the national level, hourly earnings rose from about $24 to about $33 in that time. So, Oregon started out in 2013 below the U.S., but recently passed the U.S. average and has continued to increase, according to this metric that is based on the monthly survey of businesses.

If wage increases in the U.S. had matched the rate of inflation throughout this period, wages would have only risen to about $31 per hour by early this year. This means that overall inflation was below the rate of wage gains between the starting point of 2013 and the end point in 2022. However, this pattern wasn’t consistent throughout the 10-year period. A careful study of the chart shows that consumer price inflation was more rapid than U.S. wage growth during mid-2021 through mid-2022, when consumer prices spiked dramatically. Also, a more localized CPI-U figure would be helpful here to address the recent large gains in Oregon average earnings and how they compare with local inflation, but the U.S. Department of Labor’s Bureau of Labor Statistics (BLS) does not produce state-level CPI figures.
These numbers come from the monthly Current Employment Statistics program, a federal-state cooperative program in which data are produced by the BLS in cooperation with the Oregon Employment Department. The monthly estimates are based on a sample of businesses that report total pay and total hours for their payroll employees. For Oregon’s February sample data, 792 employers, totaling $189 million of weekly payroll, provided data as a part of the matched sample.