Morrow County’s Private Industry Payroll Fell by $3.2 Million in 2021
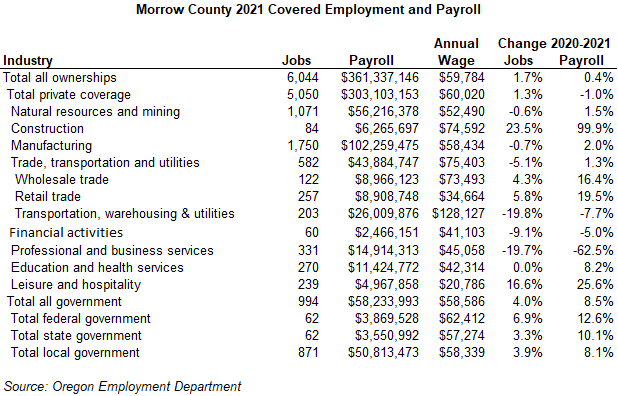
July 25, 2022Morrow County’s total all industries and ownerships payroll grew by $1.4 million or 0.4% in 2021 to total $361.3 million. Government payroll rose by $4.5 million to reach $58.2 million (+8.5%), offsetting private industry’s $3.2 million (-1%) loss. Total private payroll fell to $303.1 million in 2021, coming on the heels of 2020’s $26.4 million (+9.4%) gain. Over the two-year period, 2019 to 2021, private industry payrolls increased by $23.2 million (+8.3%) and government payrolls rose by $6.3 million (+12.1%). Morrow’s 0.4% payroll growth ranked second to last among Oregon’s 36 counties in 2021, ranking just ahead of Gilliam County, which suffered a payroll loss. Oregon’s 2021 payroll rose by 9.4% or $10.4 billion to reach $120.4 billion.
Total all industries and ownerships employment growth outpaced payroll growth in 2021, rising by 101 jobs to average 6,044, an increase of 1.7%. Morrow County remained about 130 jobs (-2.1%) below its 2019 employment peak (6,172 jobs) despite its 2021 rebound. Oregon’s 2021 employment rose by about 44,300 jobs or 2.4% to 1,880,900. Morrow County’s job growth ranked 26th in 2021 with Crook County’s 7.5% increase ranking first; 33 of 36 Oregon counties added jobs in 2021.
 Oregon’s average wage reached $64,018 in 2021, exceeding Morrow County’s average by about $4,200 or 7%. Morrow average wage ranked sixth highest in Oregon, dropping from third highest in 2020. Morrow County’s average wage ($59,784) ranked just behind Crook in fifth ($61,305) and just ahead of Deschutes ($56,598). The annual wage gap exceeded $10,000 for 26 of Oregon’s 36 counties in 2021. Only two counties, Multnomah ($72,532) and Washington ($86,181), exceeded Oregon’s 2021 average wage. Multnomah County boasted Oregon’s largest payroll in 2021, with $34.9 billion or 29% of Oregon’s total payroll. Washington County’s 2021 payroll, at $25.2 billion, ranked second (Morrow 26th). Together the two counties held 49.9% of Oregon’s $120.4 billion payroll while hosting 41.1% of its jobs. Excluding Multnomah and Washington, average pay for Oregon’s remaining 34 counties falls to $54,460, a drop of about $9,600 or 15%.
Morrow County’s private industry payroll fell by $3.2 million in 2021 to total $303.1 million, a loss of 1.0%. Despite the payroll loss, Morrow County private industry employment rose by 63 jobs in 2021, rising to 5,050, an increase of 1.3%. Payroll and employment were not reported for the information industry in 2021 due to confidentiality limitations. Other services also received confidential treatment in 2021.
Payroll losses in professional and business services reached $24.9 million in 2021, a drop of 62.5%; coming on the heels of a $12 million gain in 2020. The average professional and business services job paid $45,058 in 2021, a one-year drop of $51,461 or 53.3%. Professional and business services gained 149 jobs in 2020 but it cut 81 in 2021 (-20%), to average 331. The one-year boom and bust in professional and business services employment and payroll indicates that these high paying jobs were needed for a short-term project that reached completion in 2021.
Transportation, warehousing, and utilities cut its payroll by $2.2 million in 2021 (-7.7%), dropping its total to $26 million. Employment fell by 19.8% or 50 jobs to average 203. Transportation, warehousing, and utilities paid an average $128,127 in 2021, an increase of $16,805 or 15.1% over 2020. Wages in transportation, warehousing, and utilities exceeded Morrow County’s average by about $68,300.
Manufacturing boasted private industry’s largest payroll in 2021, at $102.3 million; just over one-third of Morrow County’s $303.1 million private industry total. Manufacturing payrolls rose by $2.0 million in 2021, an increase of 2%. Manufacturing employment fell by 13 jobs or 0.7% in 2021 to average 1,750; nearly 35% of Morrow County’s private industry employment total. Manufacturing pay averaged $58,434 in 2021, rising by $1,549 or 2.7%. Manufacturing wages lagged Morrow County’s all ownerships average pay by $1,350.
Employment in leisure and hospitality rose by 34 jobs or 16.6% in 2021 to average 239. Payroll growth was even more impressive, rising by to $1.0 million to reach nearly $5.0 million (+25.6%). Leisure and hospitality represented just 4.7% of Morrow County’s private industry jobs in 2021, while Oregon’s share was more than double, at 10.8%. Wages in leisure and hospitality rose by $1,498 in 2021 (7.8%) to average $20,786, lagging Morrow County’s all industries average by about $40,000.
Construction doubled its payroll total in 2021, rising by about $3.1 million to $6.3 million. Employment rose by 16 jobs or 23.5% to average 84. Average pay in construction rose by $28,506 to $74,592, about $14,800 above Morrow County’s average wage.
Local government payrolls rose by $3.8 million, to total $50.8 million in 2021, up 8.1%. Local government employment rose by 33 jobs to average 871, while its pay averaged $58,339, an increase of $2,224. Local government pay lagged Morrow County’s all ownerships average wage by about $1,400.