Migration Patterns in the Past Five Years
May 24, 2023Oregon is an in-migration state. For many years, more people have moved into Oregon each year than have moved out of the state. This population growth fuels the expansion of our cities and brings new brain power to foster the economic engine of Oregon’s future. Workers in some occupational groups are more likely to move than others. Where do these in-migrants come from? And when Oregonians leave, where do they go?
Data from the American Community Survey (ACS) five-year panel (2017-2021) can provide some information about migration characteristics that isn’t available elsewhere. Specifically, we can now look at migration into and out of Oregon by major occupational group.
Oregon Migration by Occupational Group
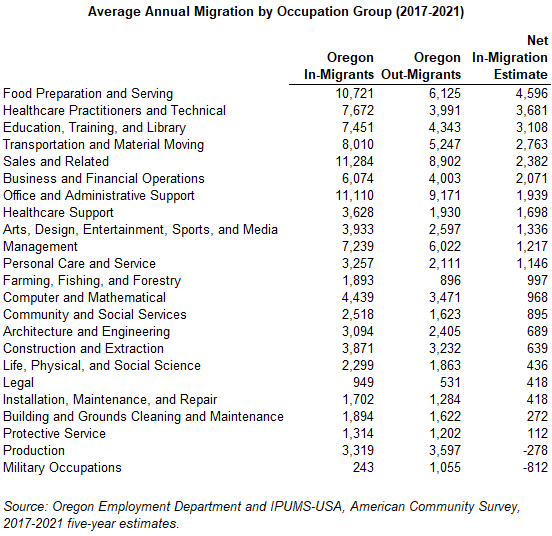
The largest occupational groups also have the largest net in-migration numbers. The top 10 occupational groups by net in-migration include eight of the top 10 groups by total employment size in Oregon. These occupations employ a lot of workers, so it isn’t surprising that many of the people moving to Oregon are working in these types of jobs.
Across occupation groups, net in-migration numbers typically account for between 1% and 3% of each group’s estimated 2017 to 2021 labor force. Production occupations averaged net out-migration of about 300 workers or 0.3% per year in 2017 through 2021. Others with slow net in-migration, averaging less than 1% of total employment, are occupations like protective service; building and grounds cleaning and maintenance; construction and extraction; and management. Occupations with a more sizeable net in-migration impact (averaging more than 3% of the group’s employment) include food preparation and serving; healthcare practitioners and technical; and farming, fishing, and forestry.
Military occupations are an exception to the overall pattern. Oregon doesn’t have much in the way of military employment, so for those occupations Oregon has seen a recent average of more than 1,100 moving away from the state and just 200 moving into the state, meaning net out-migration of about 800 per year.
Another way to look at this data is to think about the total flow of people in and out of the state. Adding up Oregon’s in-migrants and out-migrants by occupation shows where flows are the highest. Since the total level of flow is made up of movement in and out of the state, however, it isn’t captured by the net in-migration numbers.
For instance, the 1,939 net in-migration for office and administrative support workers masks the true level of flow – an average of more than 20,000 office and administrative support workers move in a given year, but we’re gaining only 1,939 more than we’re losing. Sales and related occupations have similar flow, with an average of more than 20,000 workers moving, while those moving in only outnumbered those moving out by about 2,382.
Construction and extraction trades have about 7,100 workers moving either in or out of Oregon each year, but there the in- and out-flow are fairly close, leaving a net in-migration of about 600 workers each year. Looking back at the average net loss of 300 production workers from earlier, while the net figure is small, there’s a lot of traffic going both ways, with an estimated 3,300 production workers moving to Oregon and 3,600 moving from Oregon each year.
Wage Income among Employed Movers
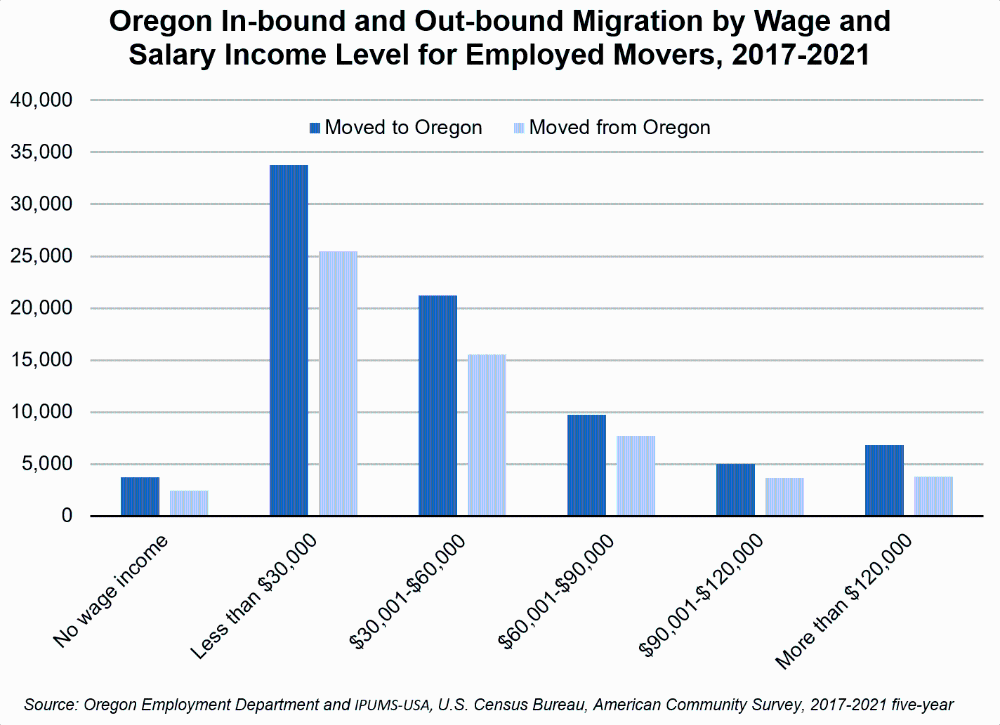
Most employed movers both into and out of Oregon are in low- to mid-income categories. These groups make up a larger share of the employed population, so that volume isn’t too surprising. Also, younger workers tend to be more mobile as they move into and out of school environments and establish careers. Younger workers have lower income as many work part-time in jobs that don’t require much experience and education, and they are newer to their jobs.
Average net in-migration among the employed in the 2017 to 2021 period amounted to about 1.1% of Oregon’s employed population. By wage and salary income level, the lowest share of net in-migration was among those making $60,000 to $90,000 in the prior 12 months, where net in-migration averaged 0.7% of the employed population. These folks may be mid-career, and also may more frequently be tied in place as they raise families. The highest share of net in-migration occurred among those who made more than $120,000, at 1.9%. Other income groups were very close to the 1.1% average.

Overall, 1.4 employed people moved into Oregon for every one employed person moving out of Oregon. The only category that differed from that average by more than a tenth was employed movers who earned more than $120,000 in the prior 12 months. Among these higher earners, 1.8 employed people moved to Oregon for every one person moving out of Oregon.
Patterns in Selected States
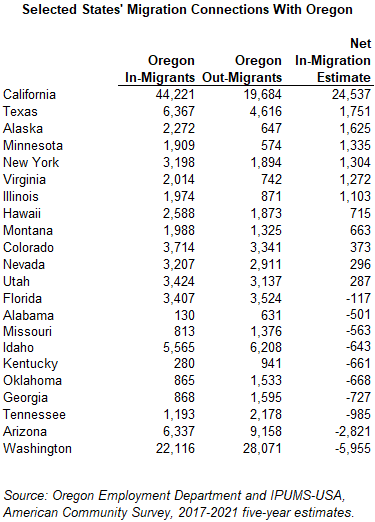
Oregon shares significant migration flow with all of its neighbors and several other western states. This table doesn’t tell the full story – there was migration flow between Oregon and every other state in the nation between 2017 and 2021. States are included in the table when in-migrants or out-migrants averaged more than 3,000, or when net migration (into Oregon or out of Oregon) exceeded 500 per year.

California was by far the greatest source of net in-migrants to Oregon. An estimated average of 44,200 people moved from California to Oregon each year during the period, while 19,700 moved from Oregon to California – leaving an estimated net in-migration of roughly 24,500 each year. On the other end of the scale, the largest out-migration was to Washington State. Oregon loses about 6,000 more residents to the Evergreen State each year than it gains from that source. Many of them may be chasing lower cost housing right across the Columbia River from Portland.
Caveat on International Destinations
One caveat to using this data series is that out-migration is not captured for international destinations. That means that net in-migration is overstated for an occupational group or geographic area when there has been some migration to other countries, and we have no way to tease that out using these estimates. It is possible that movers to international destinations are concentrated in particular occupations, and if that is the case then these estimates miss the boat to some extent.