Government and Private-Sector Average Wages
August 22, 2022It takes less than 30 seconds on the Oregon Employment Department’s website for labor market information, www.QualityInfo.org, to see that published wages for government workers were different, and usually higher, than for private-sector workers. A quick glance at Employment and Wages by Industry data under the Economic Data tab will show that Oregon’s private-sector workers made an annual average wage of $63,086 in 2021 versus $85,961 for federal workers, $75,934 for state workers, and $65,913 for local government workers.
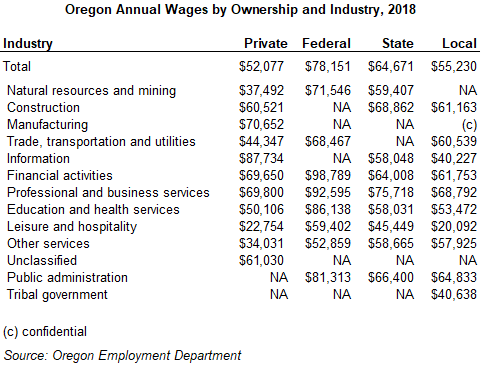
 Different industries pay different wages. Manufacturing and finance are well known as high-paying industries; leisure and hospitality is often criticized for paying low wages. Although there are some similarities in industry wages across ownerships, there are many differences. The natural resources and mining industry pays much higher wages under federal ownership than private. This industry is the U.S. Forest Service in federal ownership, and in private ownership it is mostly farming, logging, and their support industries. Trade, transportation, and utilities employment is dominated by the lower-paying retail trade industry in the private sector versus the higher-paying transportation industry (U.S. Postal Service, Trimet) and utilities (Bonneville Power, Eugene Water and Electric Board) in federal ownership and in local government.
This trend of higher pay in the public sector is reversed in a couple industries. The information industry in the private sector (software publishers, telecommunications) pays much higher wages than the information industry in local government (Fern Ridge Public Library, among others). Private-sector finance also pays a higher average wage than finance does to state or local government workers. The state finance sector is mostly portfolio management done by PERS, which pays on average less than half the private-sector wage in portfolio management. Local government finance includes SAIF, an insurance provider.
Before you either celebrate fair wages or start throwing tea in Portland harbor in protest, let’s look at some of the reasons wages are different in the public and private sectors. Because aside from wages, the public and private sectors also have different industrial and occupational mixes, different institutional constraints, and different hours of work. One quick note, this is not an analysis of public and private-sector total compensation that compares comparable work. It is simply a look behind some of the average wages that we regularly publish.
Different Industries
A principal reason that public agencies have different average wages from private businesses is that they engage in different operations and often employ workers with different skills. Although there can be considerable overlap between the types of enterprises run by governments and private businesses, the emphasis, or number employees in industries, is different. For example, there are government manufacturing and financial operations in Oregon, just not very large ones. And although both public and private schools exist, there are many more workers in public education than private education.
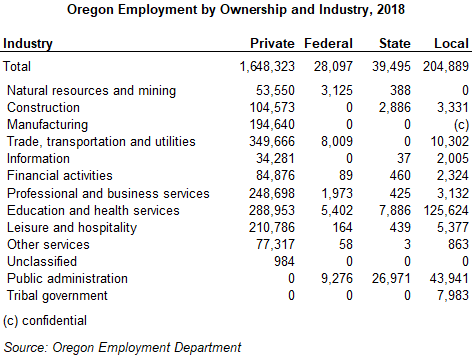
This second table shows employment by major industry and ownership. Ownership is either private, federal, state, or local government. Nonprofit organizations are typically in the private sector and can be in any industry.
 Indian tribal businesses and most public schools, including public universities, are in local government. The roughly 17,000 home care workers in Oregon were officially counted as state government workers in 2017. Since 2018, they have been classified as private-sector workers.
Governments have less industrial diversity than the private sector. Governments also have significant portions of their employment in public administration, no surprise there. Roughly two-thirds of state government employment was in public administration. Education and health services comprised 61% of total local government employment in 2021, and about 93% of this was education, such as public K-12, universities and community colleges. Federal government employment is a little more spread out: natural resources, transportation (the U.S. Postal Service), health services, along with public administration all have significant employment.
Wage Growth
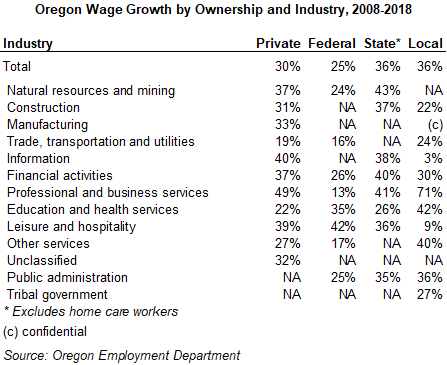
State government annual average wages grew faster than the other ownerships from 2011 to 2021. State government average wages grew by 53%. Private-sector and local government weren’t far behind, and their average wages grew by 49% over the 10 years. Federal average wages grew by only 26%. It is important to note that these changes are for average wages for the entire ownership; they are not necessarily reflective of changes to individual workers’ wages. For example, most Oregon state government workers represented by Service Employees International Union (SEIU) received cost of living increases totaling about 17.4% from 2011 through 2021.
There are a variety of reasons that average wages increase over time. A major reason is that prices also increase. The U.S. Consumer Price Index for Urban Wage Earners for the United States, a common measure for inflation, increased by 19.8% from 2011 through 2021, even more than the cost of living increases received by state government SEIU members.
Aside from general price increases, average wages can change for a variety of reasons. Hours worked, changes in productivity, and changes in the occupational mix of industries also affect how average wages change. Wages are often only part of employees’ compensation. Changes in providing other benefits, such as health insurance, can affect changes in wages. For many public employees complexity is added by legal changes, executive orders, and union contracts. During the pandemic recession and early recovery average wages in many areas actually increased rapidly as lower-wage workers lost their jobs and higher-wage workers remained employed. Gaining back jobs, hours, and benefits can occur differently for different ownerships and industries.
 Most industries managed to increase wages more than inflation, but some fell short. Unclassified workers in the private sector had the smallest average wage gain over the period at only 11% followed by federal government other services with a 12% gain. The federal other services industry consists of the two national cemeteries in Oregon. The largest wage gains were in the private-sector professional and business service industry (+77%) and the private-sector information industry (+74%). This industry has grown with the ever-increasing use of computers for business processes, and computer-savvy occupations tend to pay well.
Occupational Differences
Wages are typically influenced more by occupation than by industry, and the private and public sectors have significantly different occupational mixes. As we saw above with types of industries, the private and public sectors also employ many of the same occupations. It is the frequency or number of workers in in those occupations that differs between ownerships.
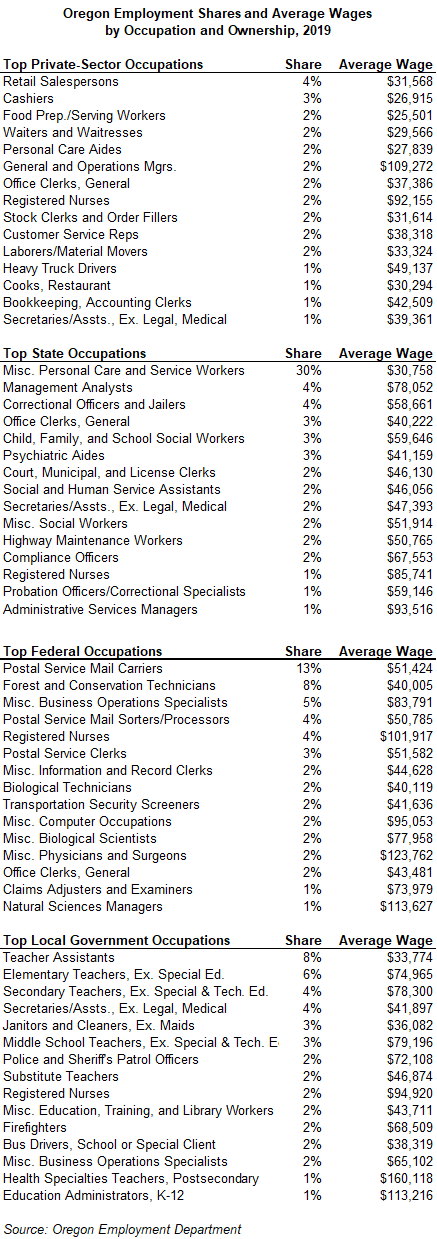
The table shows the 15 most frequent occupations in Oregon for each ownership and their share of the total employment in that ownership. The three most common occupations in the private sector were fast food and counter workers, retail salespersons, and stockers and order fillers. This reflects the size of the leisure and hospitality and retail trade industries and the importance of supply chains in our economy. Not one of these three occupations made the top 15 list for federal, state, or local governments. In fact, the highest rank that any of these three occupations had in the public sector was the 73rd spot – held by fast food and counter workers in the federal government.
 The four different ownerships had only two occupations in common from their top 15 lists: general office clerks and registered nurses.
A look at the average wages for these common occupations shows how the different occupational mixes affect the average wage for the entire ownership. The three most common private-sector occupations (fast food and counter workers, retail salespersons, stockers and order fillers) all had average wages of less than $38,000 per year in 2021. In the public-sector none of the top three occupations (three from each public ownership) had average wages of less than $38,000. In fact, only one public occupation from the top 15 lists (teaching assistants in local government) had an average wage below $40,000. In the private sector, nine of the top 15 occupations had average wages below $40,000 per year.
In the private sector only three occupations (general managers, registered nurses, and software developers) in the top 15 had average wages of more than $50,000 per year. In the federal ownership nine common occupations had averages wages of more than $50,000. State government had nine occupations that paid more than $50,000, and local government had 10 common occupations that paid more than $50,000.
It was not simply the case that occupations in the public-sector always paid more than in the private sector, though that was often the case. The four ownerships had a total of 85 occupations in common in 2021. Of these, the private sector paid the highest average wage for 12 occupations, the federal government paid the highest wage for 34 occupations, state government paid the most for 23 occupations, and local government paid the highest wage for 16 occupations. Of these occupations, the 12 for which the private sector was the highest-paying employer were usually in management and technical or scientific occupations. Federal and state government high-paying occupations were not concentrated in any major group. Local government was the highest paying employer for some technical and scientific occupations, but also for a good variety of others.
Hour Differences
Another difference between the jobs in the four ownerships is the hours worked. Full-time jobs tend to have higher average annual wages than part-time jobs, if for no other reason than employees can usually produce more by working more. The Oregon Employment Department collects information on hours worked by employee. The information does seem to have some occasional reporting errors, and it is incomplete for federal workers, so they are not included in this analysis. Nonetheless, the data from 2021 show that private-sector employees worked an average of 1,430 hours for the year; state employees worked an average of 1,722 hours (20% more); and local government employees worked an average of 1,497 hours (5% more). As a reminder, public schools and universities are part of local government, and most schools have a summer break for instruction workers.
We can compare these percentage differences in hours worked to the differences in average wages for all workers. State government wages were 20% higher than in the private sector, and local government wages were 4% higher than in the private sector. The additional hours worked by state and local government workers with respect to private-sector workers seems to explain a good part of the difference in average pay.
Summary
Wages and wage growth are important economic indicators and personally important to workers and employers. When comparing wages it is important to look not just at broad averages, but also to look at comparable industries, occupations, and hours worked. Other factors, such as location, working conditions, education, skills, experience, and benefits, also affect wages, but were beyond the scope of the data available for this analysis. These data do show that for private- and public-sector workers, differences in industry, occupational mix, and hours worked are related to differences in average pay.