Diversity in the Health Care Workforce
December 11, 2023
Oregon’s workforce is changing in many ways, but nowhere is this change as visible as in health care and social assistance. The industry is critical to economic as well as physical health in our area: health care is the largest private industry in Oregon, and offers a wide range of fast-growing and high-wage careers.
Many changes in the workforce are based on population trends and generational shifts that hold true across the economy. Just as in the total labor force, the health care workforce is getting older and more diverse ethnically and racially.
However, because health care employment has grown much faster than average, the change is more dramatic in real terms. Since 1993, the growth in employment in Oregon has been about 57%, whereas health care employment has grown by nearly 130%. This fast rate of growth magnifies the demographic changes we’ve seen across the economy. Let’s dive into a few of these changes.
Health Care, a Relatively Female Field
Health care and social assistance employment has typically been dominated by women. In 1993, 78% of Oregon health care workers were women. That percentage has actually come down in recent years, to about 74% in 2023.
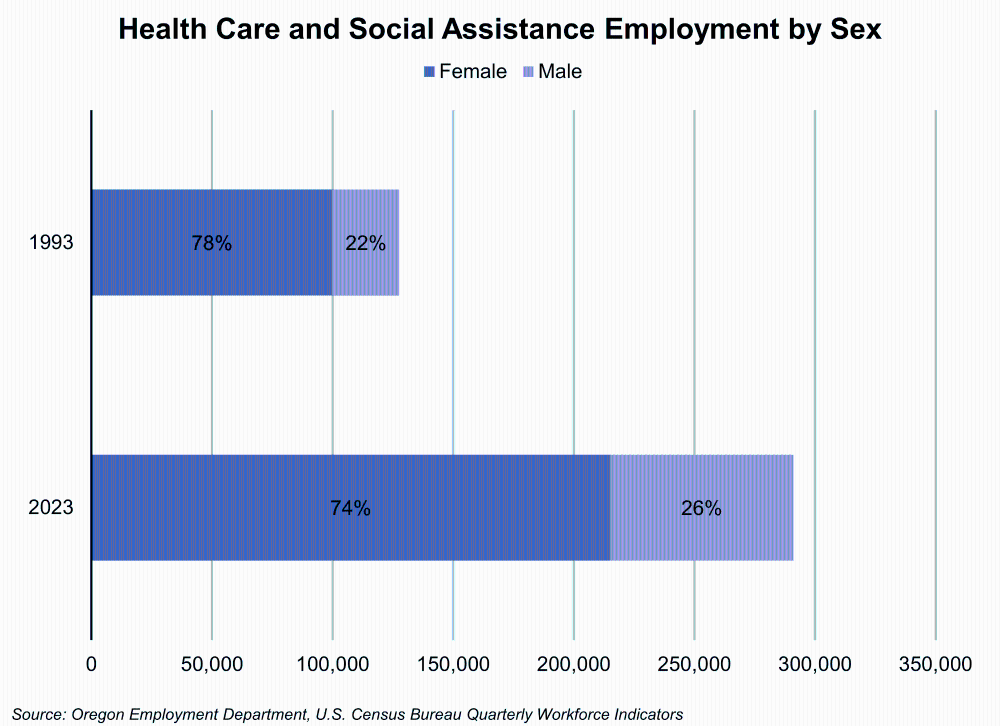
This is in contrast with the Oregon economy overall, which in percentage terms and in total added more women than men to the labor force since 1993. Slightly less than half of Oregon workers in all industries are female as of 2023.
Just as with all industries, the gender divide by occupation can be stark. Data on occupational demographics is available at the national level, and in health care some of the largest jobs are dominated by women.
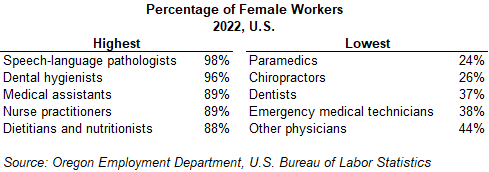
More than 95% of speech-language pathologists and dental hygienists are women. Around 90% of medical assistants, nurse practitioners, and dietitians are female, which represent some of the largest as well as fastest growing occupations in medicine.
Women are much less likely to work as EMTs or paramedics as well as in more highly-trained chiropractic or dentistry roles. The gender gap between dental hygienists and dentists, or medical assistants and certain physicians, helps explain part of the reason that average wages in health care are lower for women than men, although this gap has narrowed over time.
Growing Racial and Ethnic Diversity
In mid-2023, employment by race and ethnicity in health care closely matched the percentages seen in Oregon’s overall employment. That means that just like most areas of the economy, the health care workforce has become much more diverse racially and ethnically in the last 30 years.
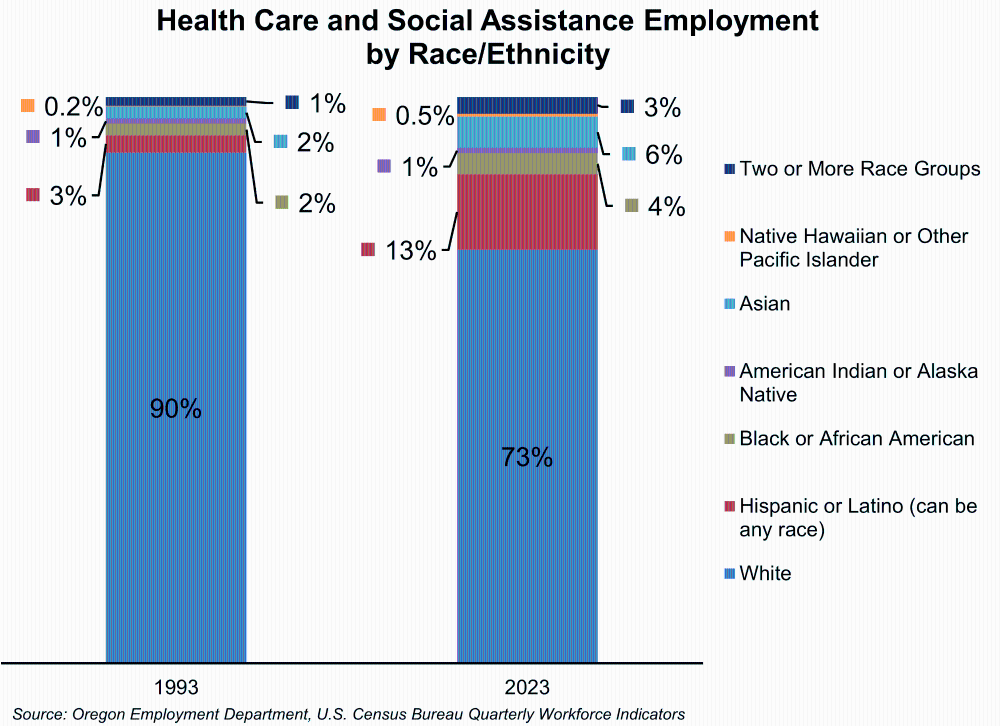
As in the total Oregon workforce, the fastest growing group is Hispanic or Latino workers (who can be of any race). There are more than eight times as many Hispanic or Latino health care workers as there were in 1993. Every racial and ethnic group has grown with the rapid expansion of the industry, but other particularly fast growing groups are people of Asian, Native Hawaiian/Pacific Islander, or two or more race groups.
As with gender, the breakdowns in occupations by race and ethnicity are far from equal in the U.S. Occupational data exists for Black, Asian and Hispanic or Latino workers at the national level. Some of the largest occupations that are most and least representative for each group are included in the table below.
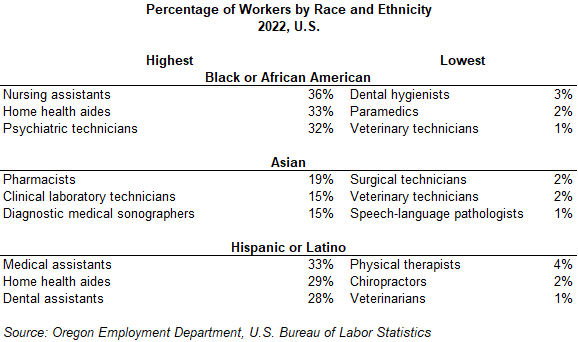
These data have important implications – not only for equity and inclusion within the sector but also the provision of health care services. If there are fewer Black paramedics, Asian speech-language pathologists, or Latino physical therapists, it may affect the general population’s ability or willingness to access the services provided in those fields.
Working Later in Life
The Oregon and U.S. population are aging, which is itself a factor in the projected growth of health care and social assistance jobs. You might expect that aging to lead to a cascading workforce transition, where younger people take on roles opened by a wave of retirements. While that is true to an extent, it’s also the case that the working population itself is aging. Workers are more likely to work past 65 than they used to, and health care workers are no exception.
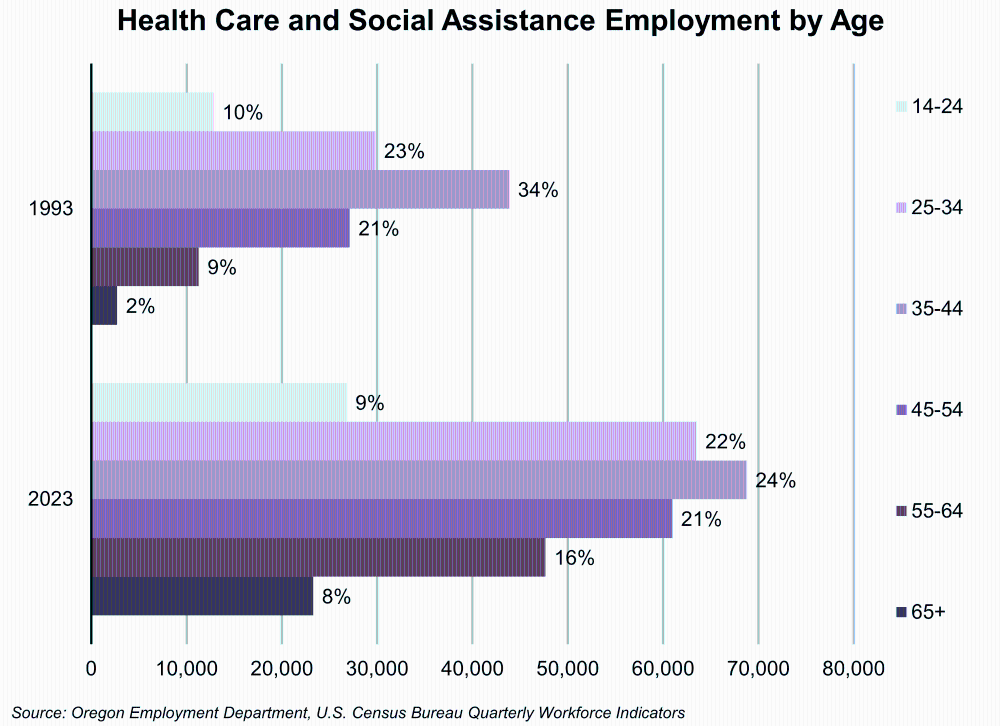
As with race and gender, workers in every age category were more numerous in 2023 than in 1993. However, as a percentage of the workforce, workers younger than 45 made up less of the workforce in 2023 (55%) than in 1993 (67%). Workers 55 and older, and particularly those 65 and older, make up a much larger share of health care workers today.
The older health care workforce aligns with trends in the labor force and population overall. The number of workers older than 65 has grown very rapidly, and the labor force participation of young workers, particularly teenagers, has fallen as more young people opt for additional education instead of employment.
Diversity Matters in a Tight Labor Market
It’s no secret that employers are struggling to find workers in the current low unemployment environment. Health care has grown rapidly in recent decades, and consistently tops the list of industries with the most difficult-to-fill job vacancies. Employers in health care know what it means to hire in a tight labor market, and many are striving to be as creative as possible in overcoming gaps.
In this sense, the diversity of the sector is a key tool to combat workforce shortages and better serve patients. By looking at the sector’s makeup, we can judge how well health care employers are accessing all parts of the labor pool. By looking at industry disparities, we can ensure the population benefits equally from job opportunities as well as the care provided by the health care system.