Job Flows in Oregon: Pandemic Decline and Recovery
March 20, 2023The past few years have seen profound upheaval in Oregon’s labor market. In March and April 2020, Oregon lost 281,000 nonfarm payroll jobs, a dramatic 14.2% decrease. The recovery since April 2020 has been similarly dramatic. From April 2020 to April 2021, Oregon gained back 172,000 jobs.
Job-to-job flow data collected by the Census Bureau provides a detailed look at the dynamics behind these large shifts in employment. Job flow data estimate worker movements across jobs and geographic labor markets and provides information about worker demographics.
Total Geographic Job Flows Dropped During Pandemic, Net Flows Changed Little
Oregon’s largest geographic job-to-job flows occur with Washington and California. The Pandemic Recession in March and April 2020 significantly reduced the total flow of jobs between Oregon and these neighboring geographic labor markets. These flows mostly rebounded by the second quarter of 2021.
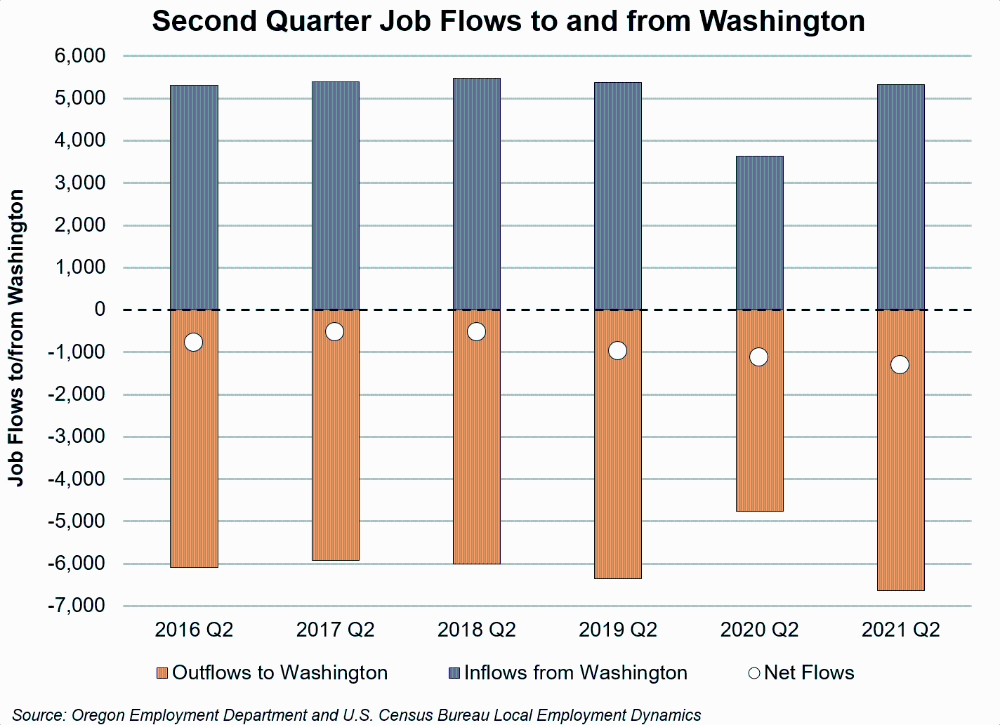
From 2016 to 2019, an average of 5,300 jobs flowed into Oregon from Washington in the second quarter. Flows out of Oregon into Washington are usually higher, averaging 6,000 jobs. This means that Oregon tends to lose around 1,000 jobs to Washington in the second quarter of each year.
Total flows in both directions dropped to pandemic-induced lows in 2020 but recovered in 2021. In 2020, only 3,600 jobs flowed into Oregon from Washington and 4,700 moved out of Oregon. By the second quarter of 2021, however, total job flows reached their highest levels in the last five years.

While the total level of job flows contracted during the Pandemic Recession, net flows were largely unchanged. Oregon lost around 1,100 jobs in the second quarter of 2020 to Washington and around 1,300 in 2021. These levels remained comparable with previous years.
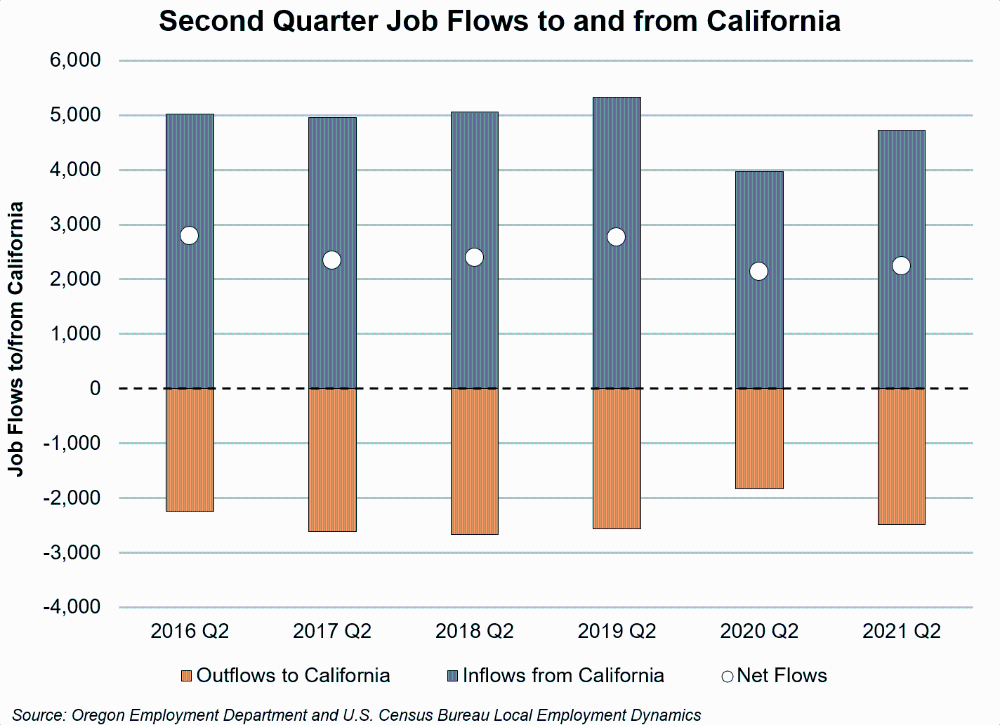
A similar dynamic was evident in job flows to and from California. About 5,000 jobs usually flow from California into Oregon in the second quarter. In 2020, this figure was just 4,000. Oregon usually sees an outflow of about 2,500 jobs to California, which dropped to 1,800. In 2021, second quarter total job flows came close to full recovery.

Net flows to and from California were not significantly impacted by the Pandemic Recession and recovery. Oregon typically gains between 2,000 and 3,000 jobs from California in the second quarter of each year. Oregon gained 2,100 jobs in 2020 and 2,200 jobs in 2021.
Flows Out of Leisure and Hospitality Increased During the Pandemic
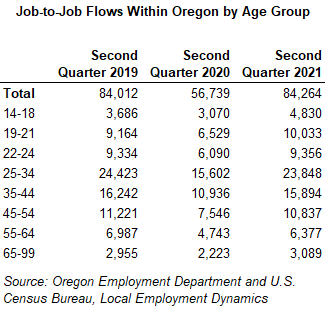
Total job-to-job flows within Oregon mirrored the sharp drop and quick recovery of employment. Around 80,000 workers in Oregon switched jobs in the second quarter of the years leading into the pandemic. In the second quarter of 2020, just 57,000 people changed jobs. By 2021, this number increased to over 84,000, slightly more than the figure in 2019.
The pandemic not only impacted the level of job flows, but also the makeup of these flows. This was especially true for the leisure and hospitality supersector, which is made up of accommodation and food services, and arts, entertainment, and recreation. These sectors retained fewer job switchers, a larger share of whom sought work in other industries.
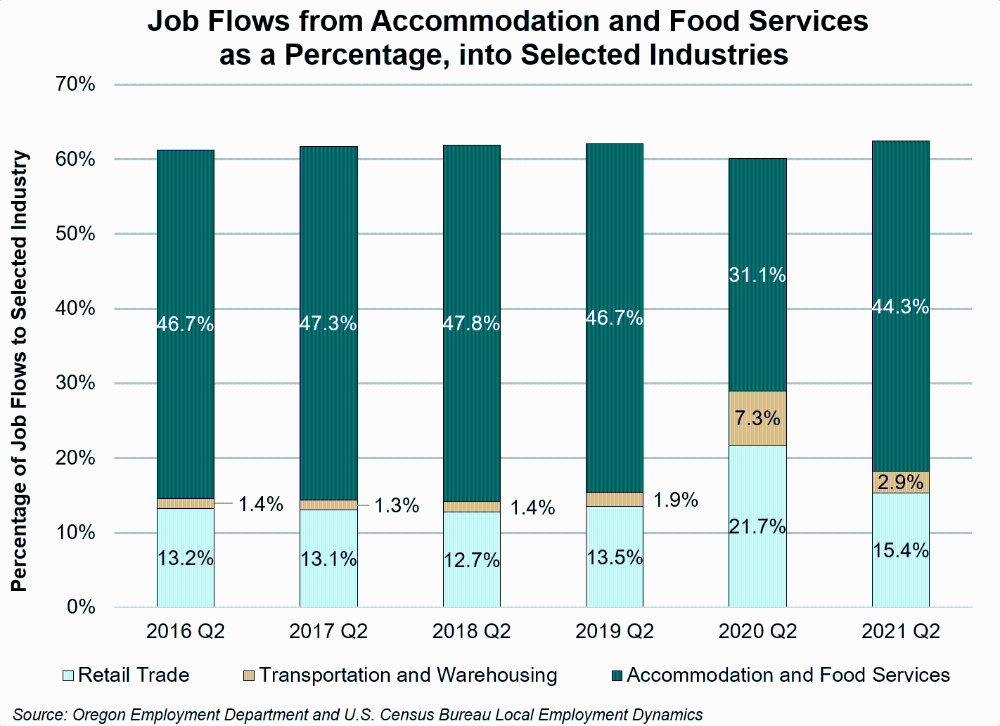
Using accommodation and food services as an example, close to half (over 45%) of workers who leave a job within this sector have historically found a replacement job in the same sector. During the second quarter of 2020, only 31% of accommodation and food services workers switched to another job in the same sector, a 16% decrease from the previous year.
This meant that an increasing percentage of job switchers found jobs in other industries during the pandemic. The largest percentage increases in flows were to retail trade and transportation. Job flows to the retail trade sector nearly doubled from its historical average of 13% to 22%. Transportation and warehousing usually only receives about 1.5% of flows, but in 2020 this number grew to more than 7%.
Combined, these three industries typically account for 60% of the job flows from accommodation and food service. While the total percentage didn’t change, the percentage of jobs flowing into retail trade, and transportation and warehousing increased.

This decreased job flow within the industry was mirrored by the arts, entertainment, and recreation sector. Even though job flows in both sectors mostly returned to their pre-pandemic makeup in 2021, the percentage of job switchers remaining in-sector is lower than before the pandemic.
Job Flows for Prime-Aged Workers Saw Largest Pandemic Decline
Within Oregon, workers in the 25 to 34 age category saw the largest change in job flows in the last two years. In the second quarter of 2019, 24,400 workers in this group changed jobs. In 2020, that figure was just 15,600, before nearly returning to its pre-recession level in 2021.

The over-the-year percent changes in job flows within Oregon were similar among age groups. The 2020 recession decline was most pronounced for prime-aged workers (workers between 25 and 55). Job flows in this age group dropped by an average of 34%. Young workers ages 14 to 24 experienced a 28% drop and older workers aged 55 and over experienced a 30% drop.
The recovery of job flows by age group was also similar in the second quarter of 2021. The year-over-year percentage change was highest for young workers with a 55% increase in job flows. Prime-aged workers also saw a large increase in job flows with a 47% increase. Older workers had the smallest growth in job flows at 39%.
It is important to note that job flow growth in 2021 for all age groups was substantially elevated compared with historical levels. The typical growth between age groups for flows within Oregon hovers around -1% to 1%.
The Data
The U.S. Census Bureau’s Longitudinal Employer-Household Dynamics program provides information about the origin and destination of workers changing jobs. These job-to-job flow statistics show the age, gender, industries, and geographic location of workers entering and leaving Oregon. They also provide insights on job movements across industries within the state. Tools to explore this data can be found at https://j2jexplorer.ces.census.gov/.